If your content is long or hard to describe in words alone, animated infographics might be a perfect alternative. They help briefly convey the information in an easy-to-understand manner.
This blog post includes:
- What is Infographic?
- Animated Infographic Overview – From Static to Interactive
- 8 Reasons to Give Static Infographics a New Life
- 3 Types of Animated Infographics with Examples
What is Infographic?
As you know, we can get information by reading, listening, and observing. The best way for most of us is often a combination. A study – Dale’s Cone of Experience – found that people generally remember:
- 10% of what they read
- 20% of what they hear
- 30% of what they see
- 50% of what they see and hear
- 70% of what they say and write
- 90% of what they do as they perform a task
Accordingly, reading is the least effective method to strengthen knowledge retention. The human brain takes a lot of time to process letters and numbers. After a few days, 90% of the info received this way will be forgotten. So, using walls of text is not an effective way. In this case, infographics might not disappoint you. They can be classified in 10 infographics types to help you best utilize information designing.
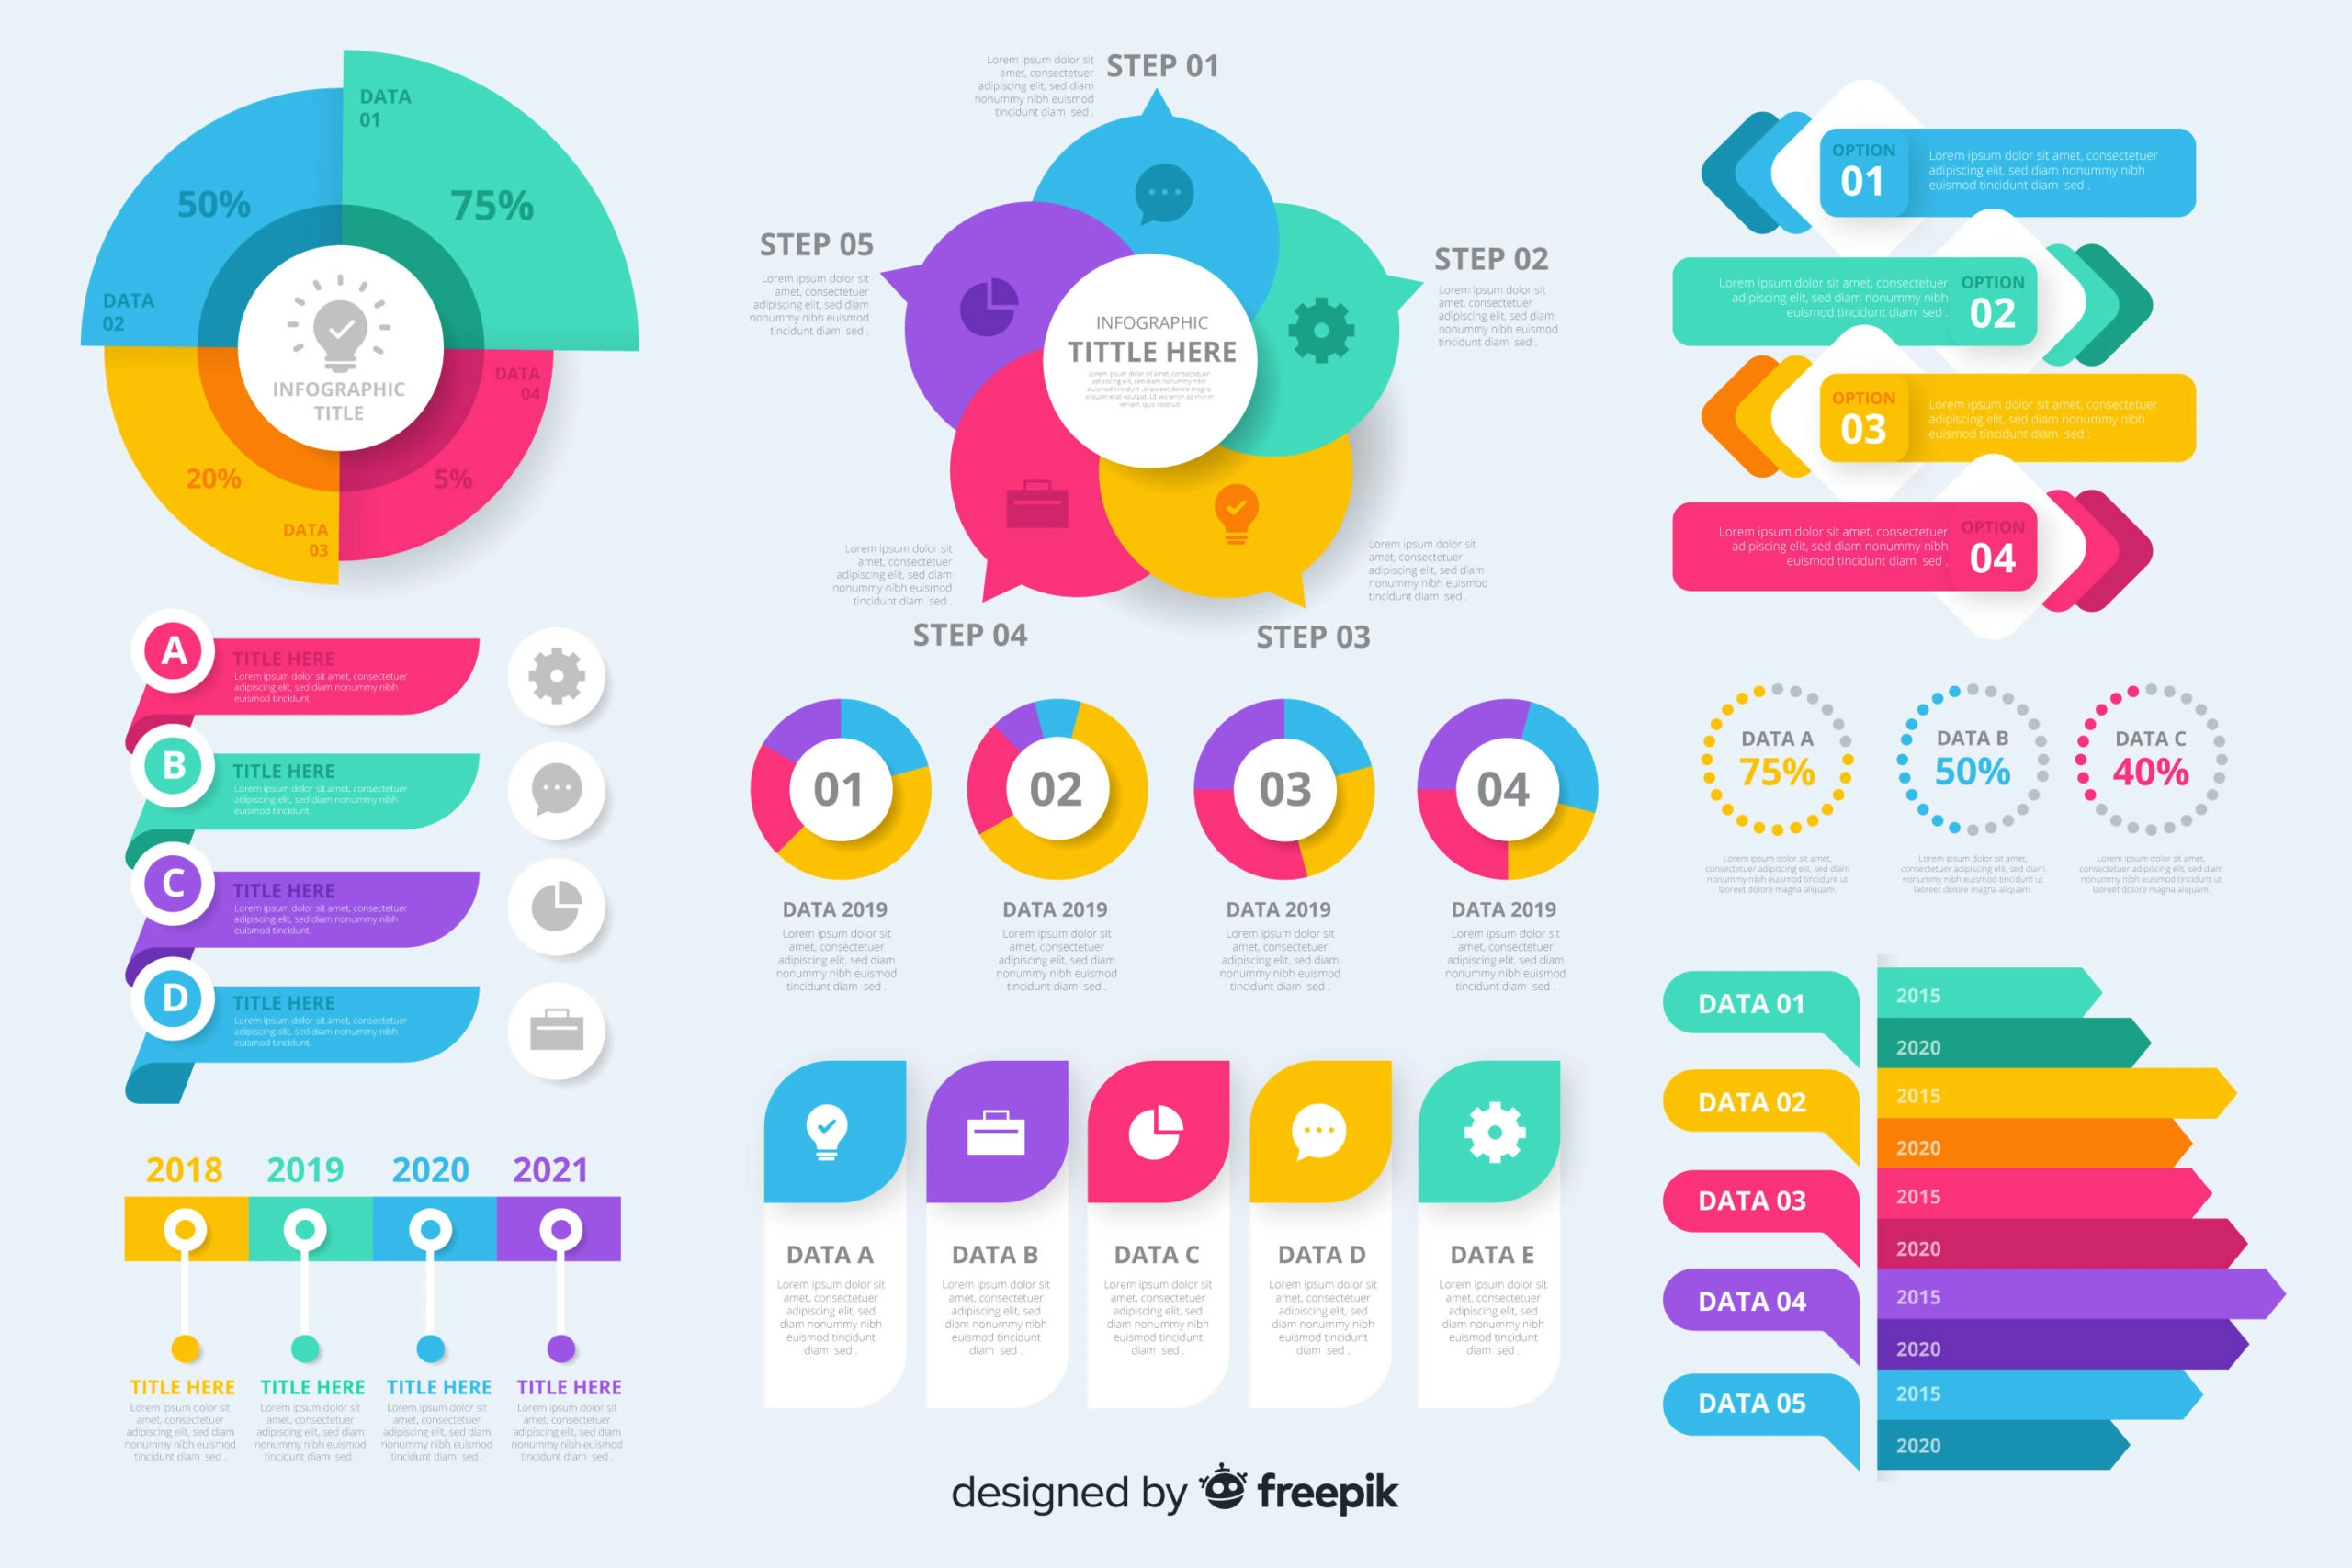
“Infographic” is formed by two words: “Information” and “Graphic”. To put it simply, an infographic is a visual display of content. It uses a collection of images, charts, graphs, icons, shapes, and minimal text. Thanks to that, an infographic helps briefly convey the information in an easy-to-understand manner. If your content is long or hard to describe in words alone, it might be a perfect alternative.
Looking to create effective eLearning courses, don’t forget to try our winning star, ActivePresenter, one of the best eLearning authoring software for teachers and trainers.

Animated Infographics Overview – From Static to Interactive
Let’s do a test together. Search the term “infographics” on Google. Then, see the number of search results it reveals to you. It reached nearly 2 billion search results (counted to December 2021). As you can see, infographics are crowd-pleasing today. Many industries are using them, from digital marketing to eLearning. Since its first appearance, the most popular format of infographics is image.
Nowadays, there is a boom in publishing platforms and social applications. They not only support image formats but also a variety of other ones. For example, videos, GIFs, HTML5. As those apps have been evolving, so have their viewers. Modern people are seemingly always in a hurry. Thus, you just have 8 seconds to grab your audience’s attention. With such a short time, moving elements can help your content stand out from the crowd. Those forms help engage viewers’ minds from the start to the finish. People have therefore begun to prefer animated infographics over static ones.
It is a huge wasted opportunity if you don’t know how to reuse available static infographics. In the following section, you’ll explore eight reasons why you should and how effective infographics brings to education.
8 Reasons to Turn Static Infographics into Animated Ones
In our previous post, you know that animated infographics are one type of animation that is easy to create. You also find why interactive infographics are having a moment in recent years. The below table summarizes eight reasons why you should turn static infographics into animated ones:
| 1. Reuse and give your static infographics a new life. | 5. Highlight what matters. |
| 2. Make complicated concepts easier to understand. | 6. Have the storytelling ability. |
| 3. Catch the eye better. | 7. Inform and entertain viewers at the same time. |
| 4. Boost audience engagement. | 8. Increase information retention. |
3 Types of Animated Infographics with Examples
There are three formats of animated infographics you can choose from, including:
GIF Animated Infographics
GIF seems to be the easiest format of the three to create. But it doesn’t mean it is necessarily less effective than the others. Check out the GIF animated infographic below:
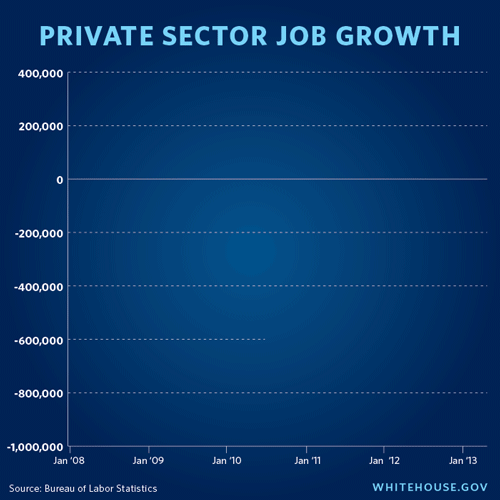
Private Sector Job Growth
Are you aware that the infographic is telling a story? The story of what happened to private-sector jobs after President Obama took office. The infographic utilizes the entrance effect and the color change effect. Even though these animations are simple, viewers are unable to take their eyes off them. They stay longer and look around to see what it is illustrating. Besides, the minimum amount of text lets them get the information quickly. Adding animations to a static infographic this way helps highlight facts and figures. It makes dry statistics more digestible since they are presented as a story.
Video Animated Infographics
GIF format lacks the ability to play sound. That’s where video animated infographics come in to overcome its limitation. This type works as explainer videos. See the video below:
Isn’t it compelling if you can simultaneously watch and listen to something being explained and visually presented to you?
With video infographics, content creators have full control of:
- What story do they want to tell?
- How are the characters?
- What will happen on the screen?
- How fast or slow will the story happen?
- What will the background music be like?
- And so on…
Combining visuals and audio elements helps to stimulate viewer emotions much better. For this reason, a video animated infographic is an effective way to convey notions. Nowadays, you can find many tools which can help not only create animations but also export your projects to video format.
Interactive Infographics
Although the video format is a great choice, viewers still play passive roles. In detail, they can just watch, but cannot interact with them. So, if you want to optimize your viewer experience, consider using interactive infographics. This format allows users to explore the content by interacting with them. They can go at their own pace and choose their own adventure.
In the example above, you can click the Prev or Next button to see the animated infographic slides that you want.
Among the three types, interactive infographics is considered as the most complicated one. Yet, it is also the most preferable one that is expected to grow. With the ability to help viewers interact with content, it can significantly boost their engagement.
That’s all about animated infographics. Keep following our website to update the latest articles!