A broad understanding of infographics types will widen your options when presenting complex data in an infographic poster. Take a visit to today’s blog post to sort out your exact match.
In eLearning course development,infographics are an effective technique for rapidly and clearly presenting the information. They enhance learners’ ability to grasp key concepts by integrating text, visuals, and data into a unified and engaging learning experience. To create effective infographics, eLearning authoring tools like ActivePresenter make it easy for instructional designers to create engaging infographics. It offers a variety of built-in shapes, icons, and charts, simple drag-and-drop functionality, and interactive elements to make infographics more dynamic and engaging for learners, fitting various learning needs.
In this blog post, we’ll discuss 10 types of infographics and when each one should be used.
The outline will be packed in an infographic poster below
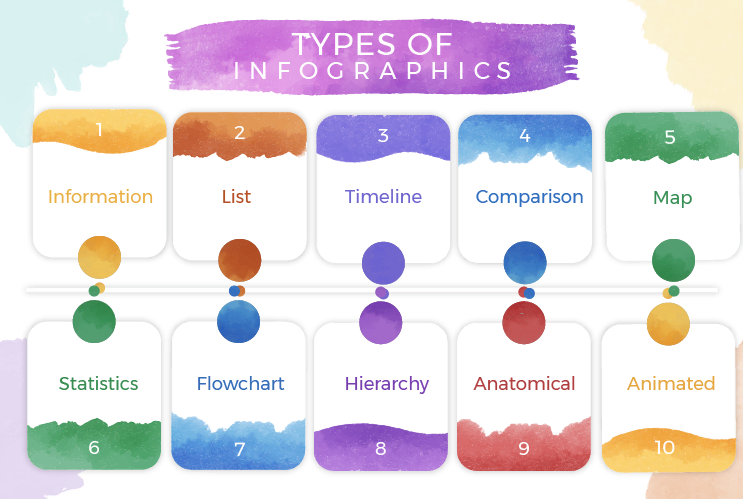
Inspired by Freepik
Types of Infographics #1: Information
Compared to other infographics types, informational infographics typically contain more text. Therefore, they are ideal for using images to teach any concepts or subjects visually. Moreover, building content infographic like this will help you build trust since they let you educate your audience and show your major knowledge.
Takeaway ideas:
- Internet usage report in a country/a city
- Health treatment information
- Worldwide travel information
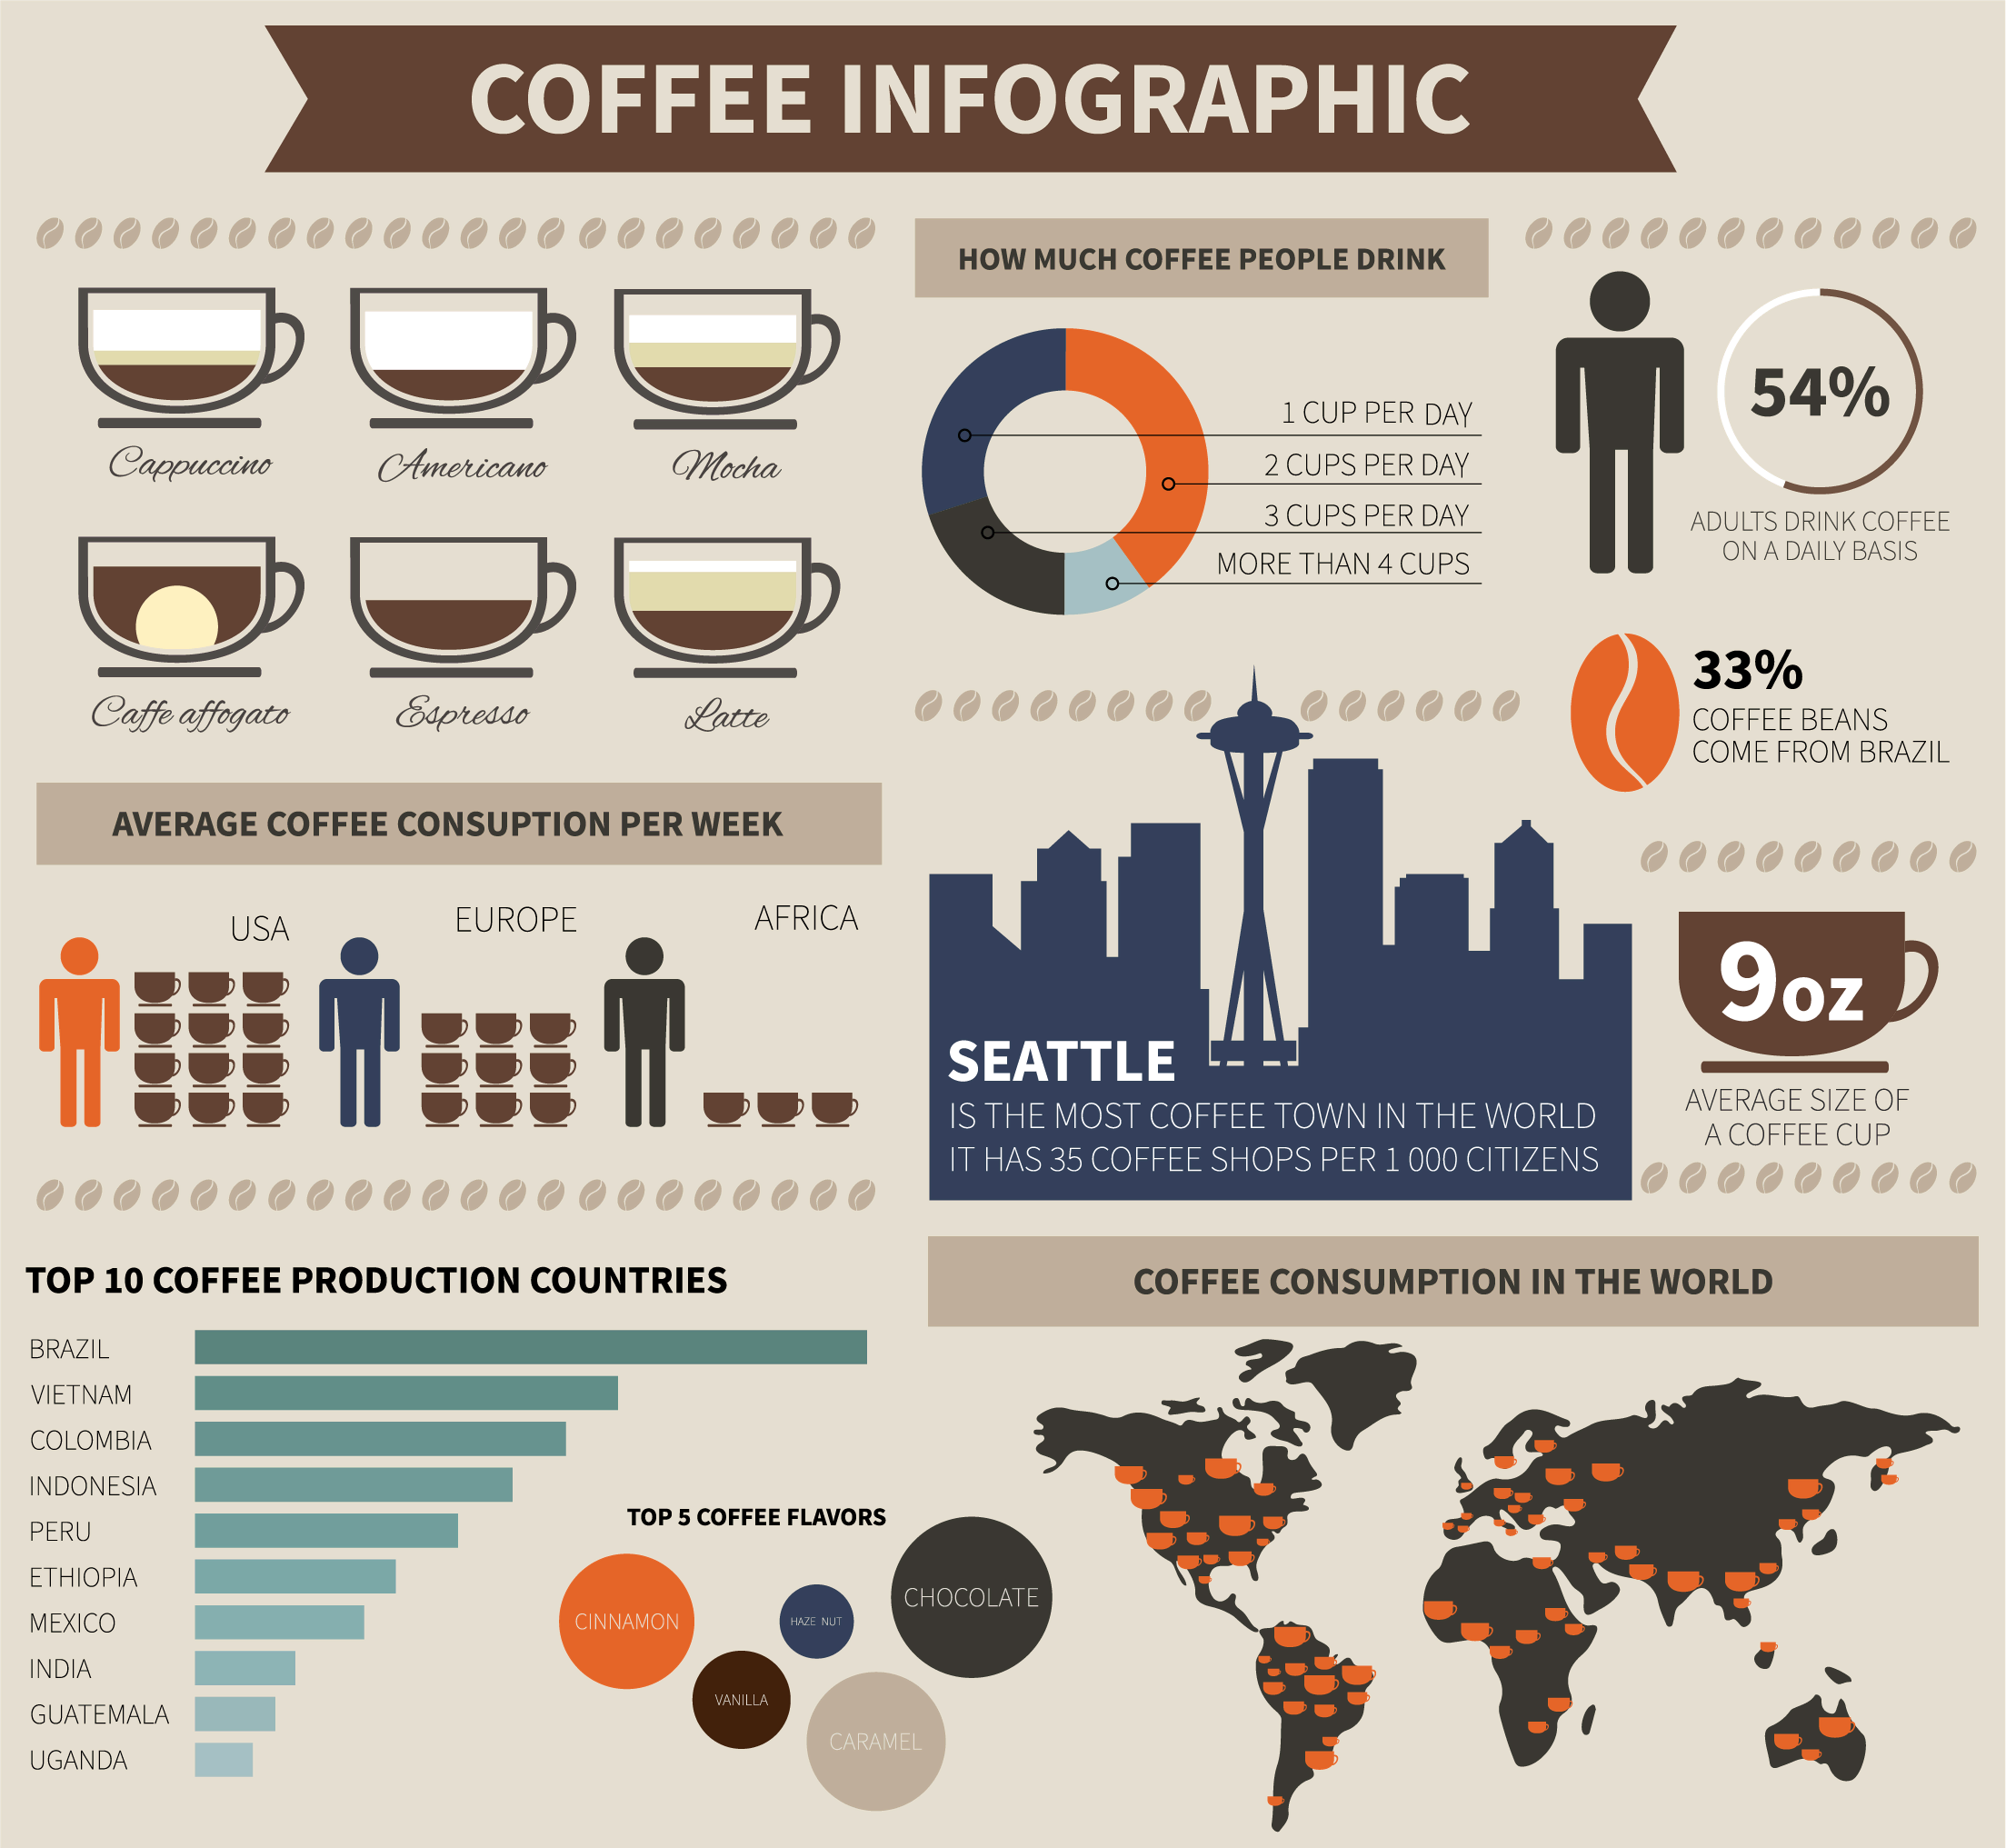
Coffee Infographic Image Vector by Favete
Types of Infographic #2: List
List infographics are one of the most popular types of infographics. Thus, they work well to draw viewers and increase interaction. In contrast to a bullet list, they allow viewers to arrange data in a more appealing way. You can use it to list anything that you think your readers will find helpful.
Takeaway ideas:
- Factors affecting global warming
- Rules at the workplace
- Checklist before having business travel

Image by Freepik
Types of Infographic #3: Timeline
Since a timeline is often arranged in a linear layout, this infographic type is quite popular with historical topics and future events forecast. To emphasize the information, images or visual graphics might be applied into the timeline. Otherwise, this type of infographic can shorten a long, complex story easier to understand. One way is to explain how something has evolved over time, or how one thing leads to another.
Takeaway ideas:
- The historical development of Earth/human beings/a nation
- Company future growth plan
- Biography of a famous person
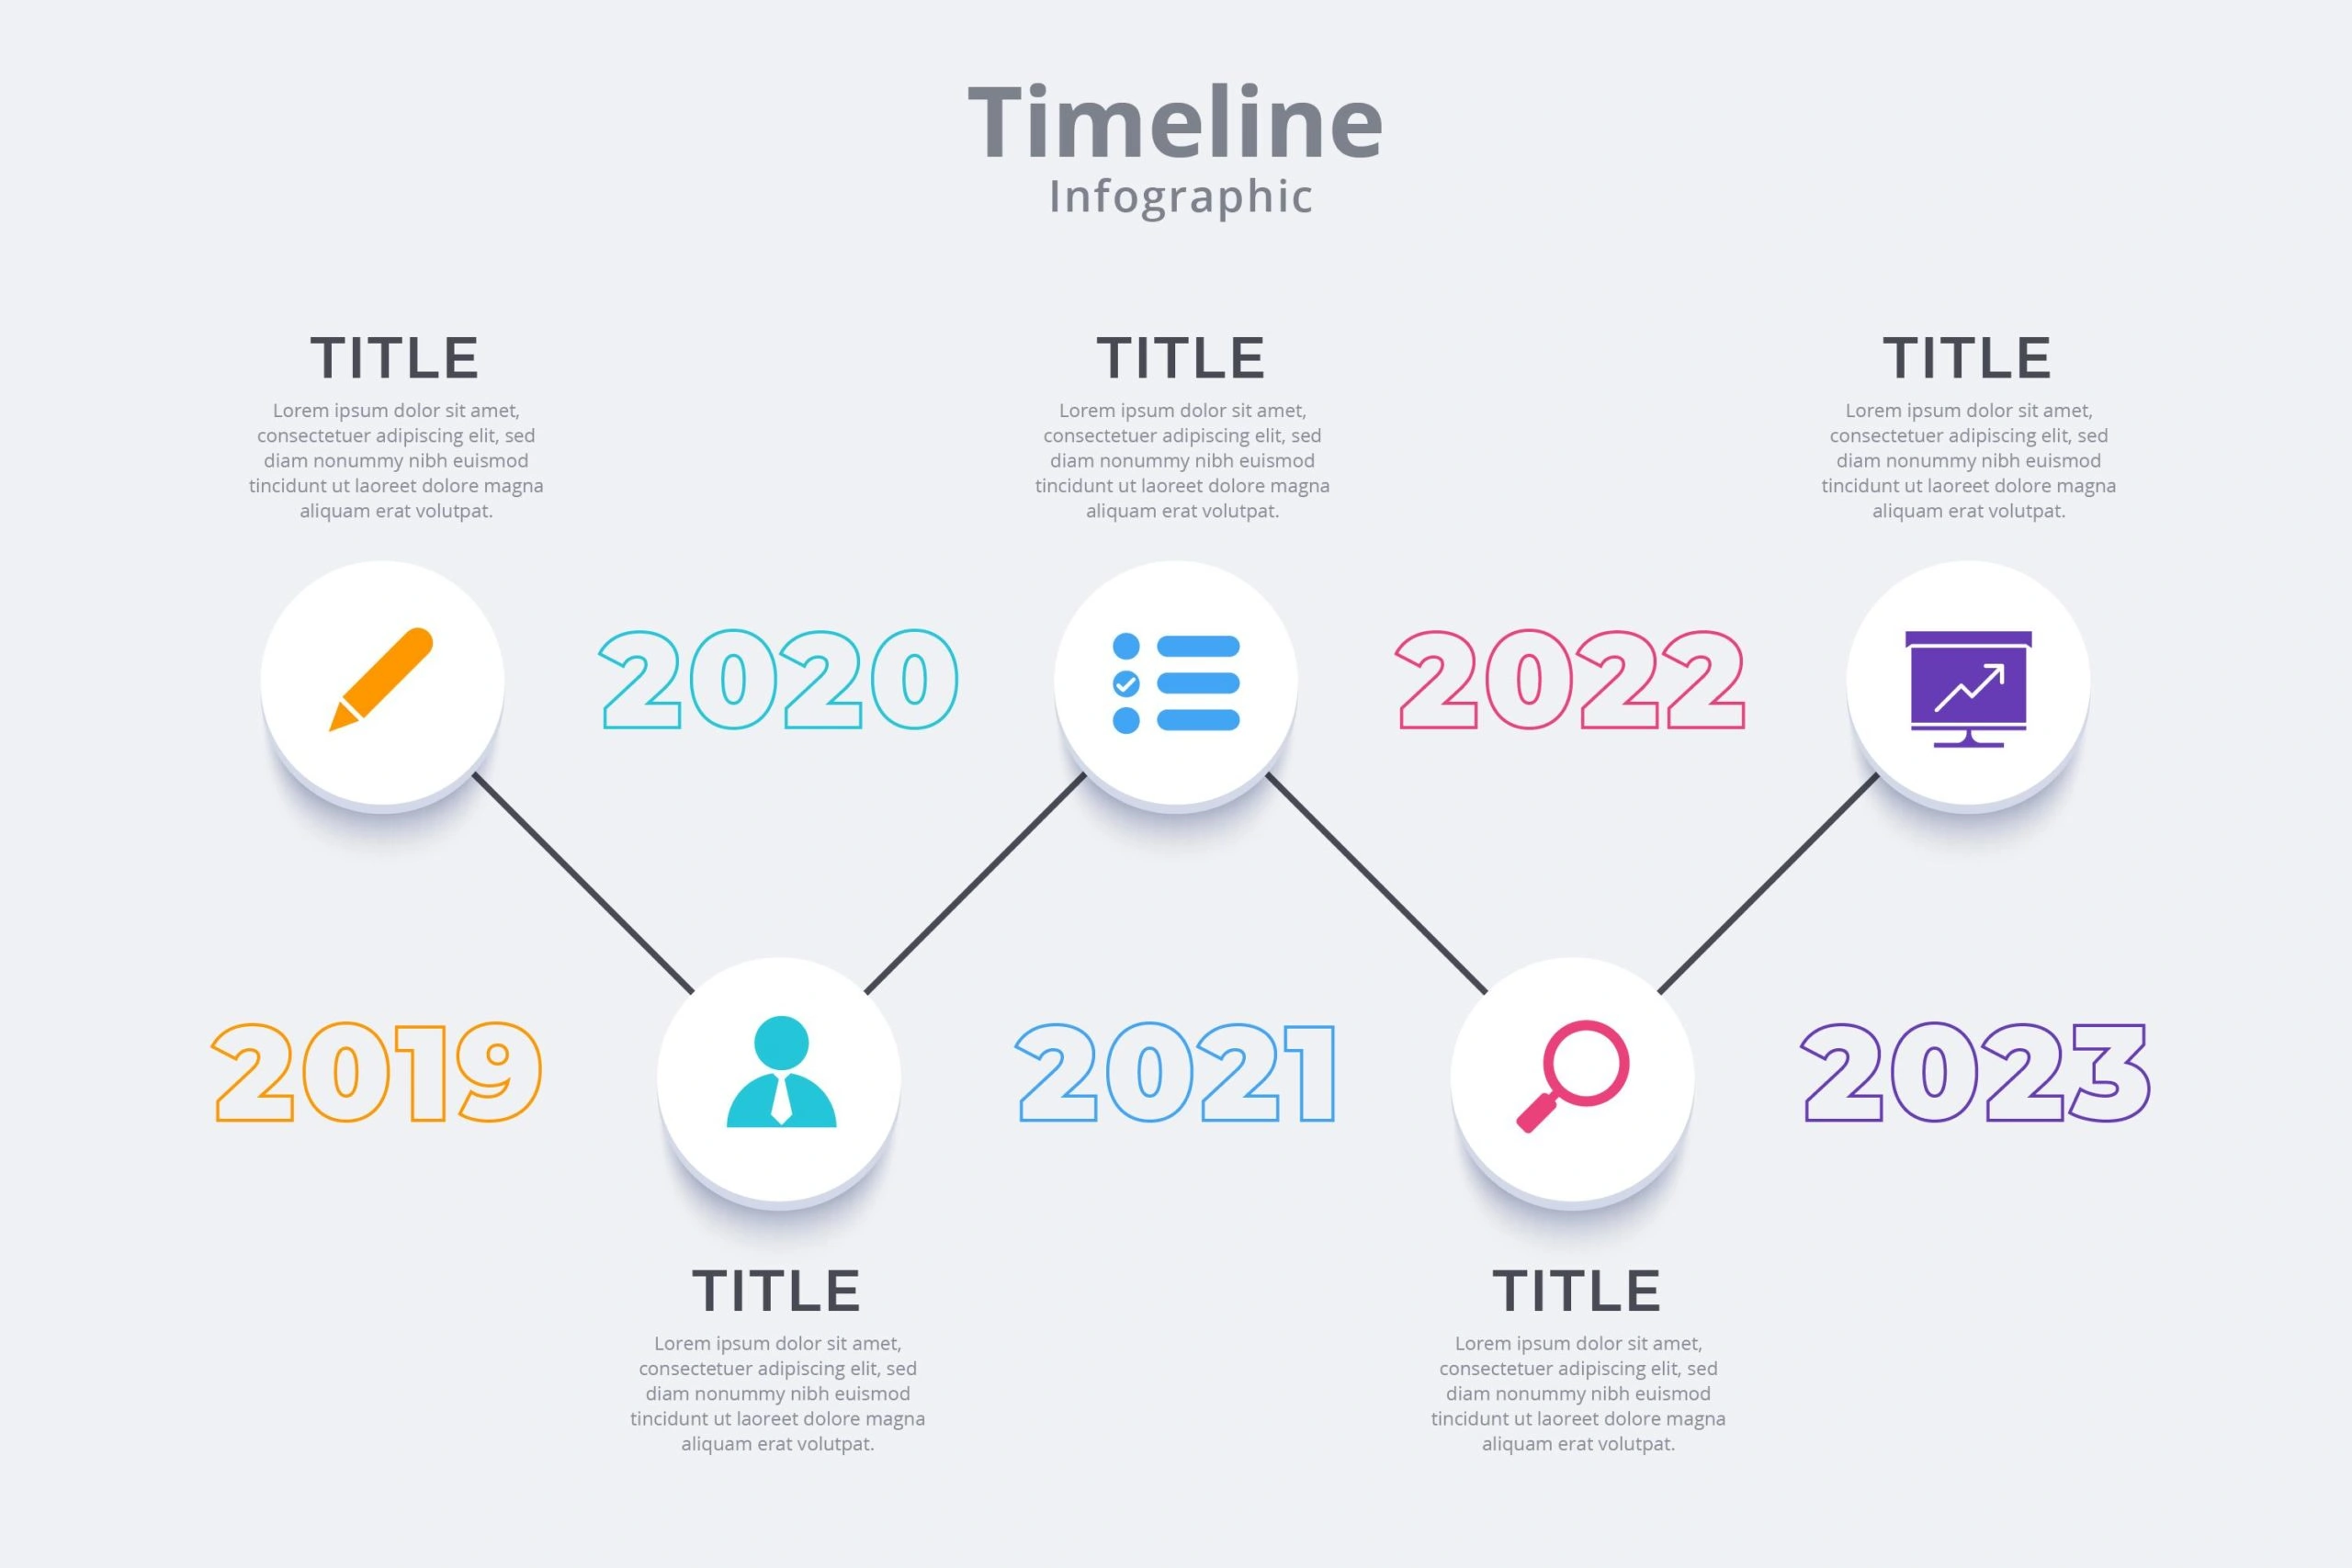
Image by Freepik
Types of Infographics #4: Comparison
Comparison infographics are a wise choice when you want to highlight contrast effects. In most cases, a comparison infographic will have one option on each side of a divide, either vertically or horizontally. By doing so, this makes it possible for the audience to distinguish between two or more items visually. Since they are presented in side-by-side infographic poster format, they can highlight similarities, contrasts, and relative relationships.
Takeaway ideas:
- Company A and B comparisons
- Advantages and disadvantages of something
- Pricing plans & features comparisons
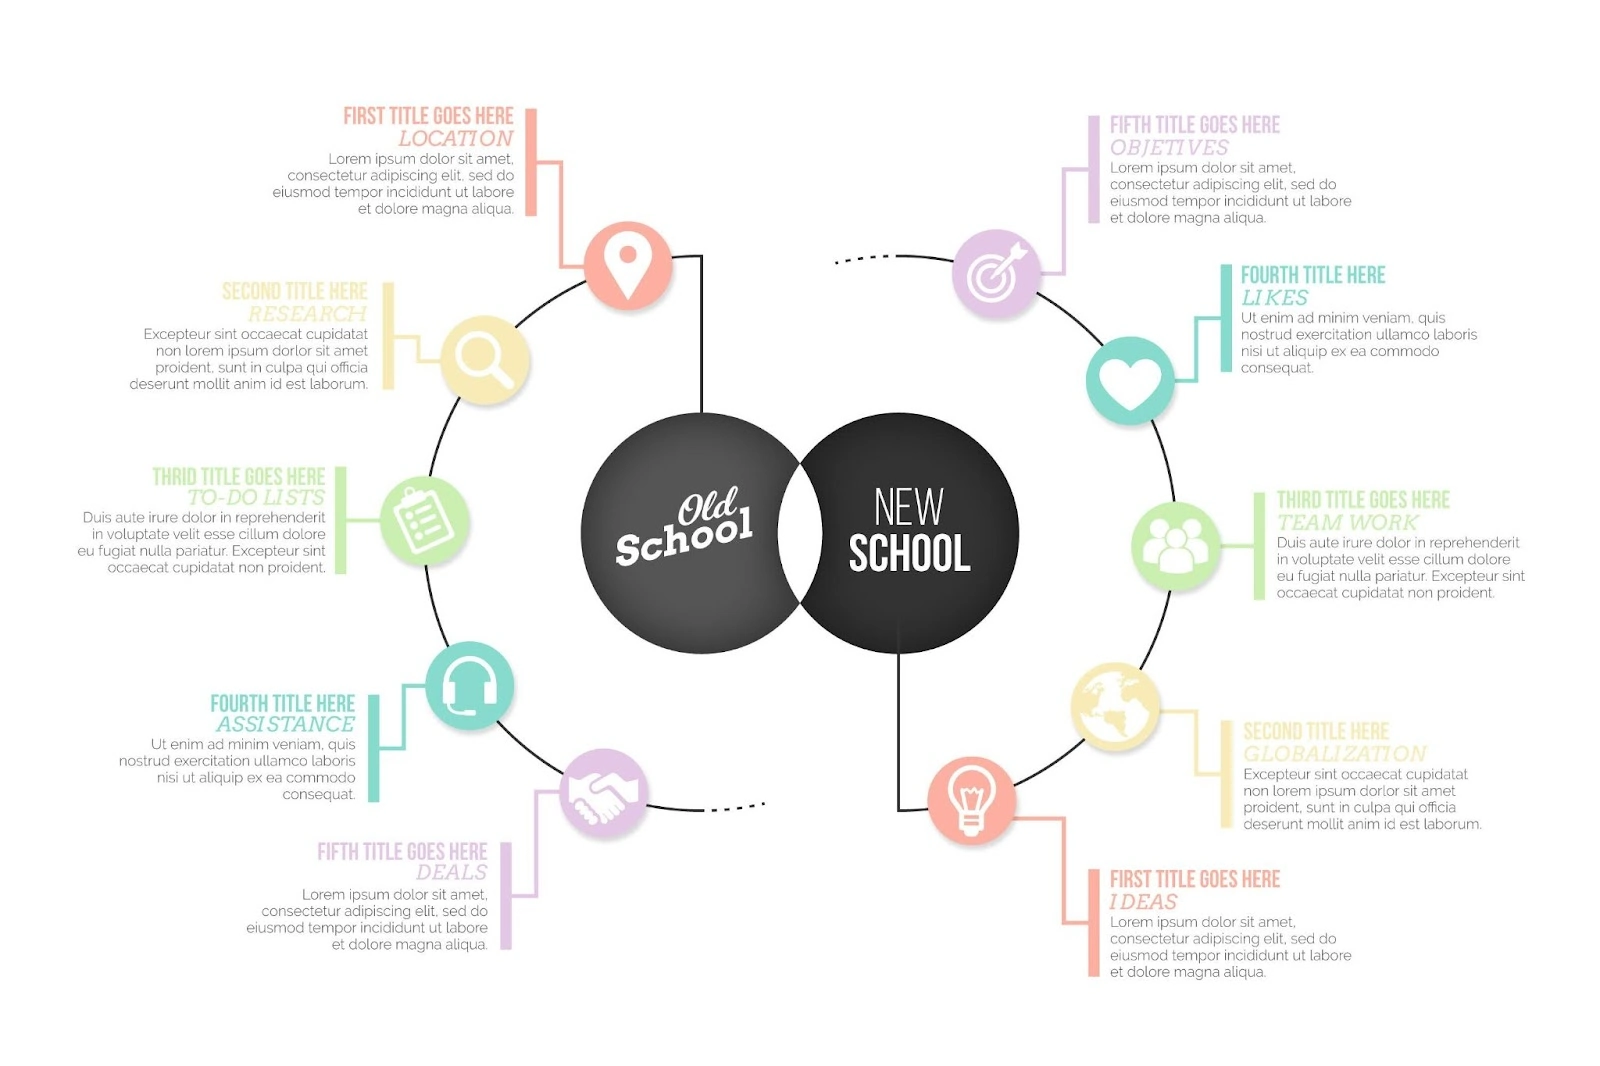
Image by Freepik
Types of Infographics #5: Map
Using a location infographic is one of the finest methods to express patterns visually across a region or worldwide. Specifically, this style of visual is excellent for pointing out regional and worldwide statistics that readers care about. Moreover, it is also possible to use map infographics to compare a wide range of selections as well.
Takeaway Ideas:
- Branches of Starbucks worldwide
- Living costs across the nation
- Good food stores in a city
- Company geographical sales distribution.
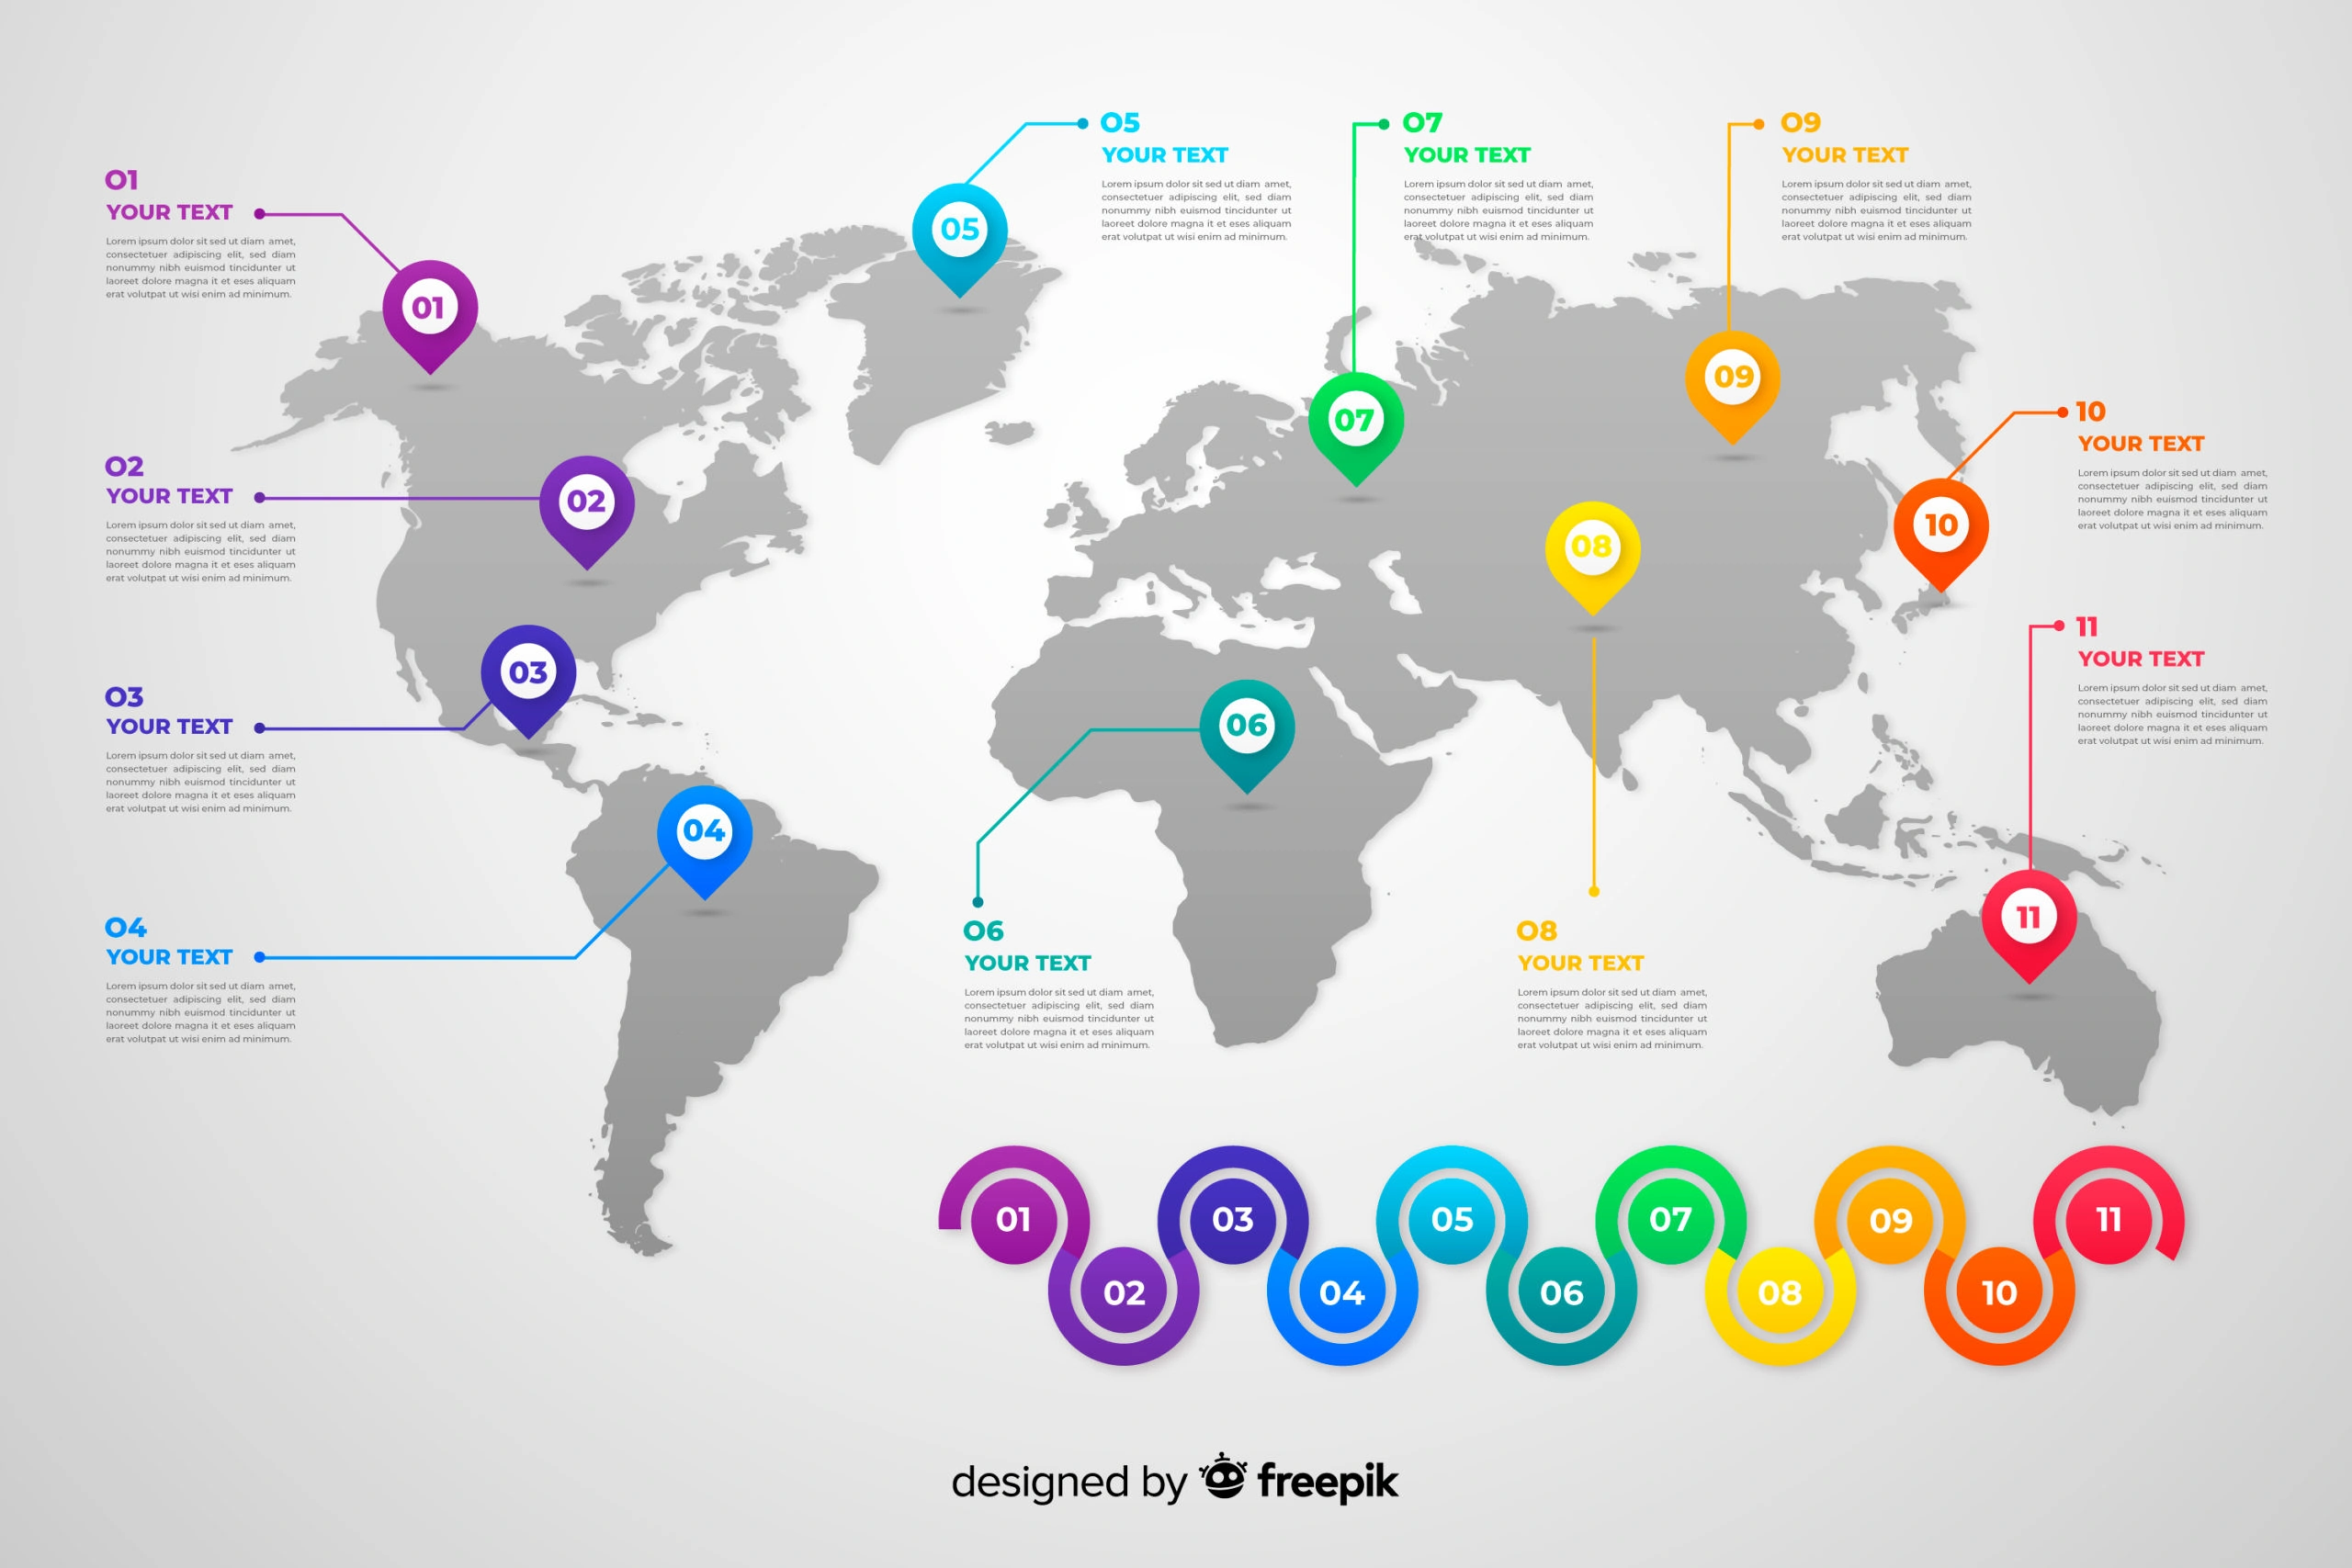
Image by Freepik
Types of Infographics #6: Statistics
Statistics infographics are given birth to digest complex and nuanced data. For this reason, we can use this type of infographic to portray data from many sources or present survey results. By using a combination of text, charts, images, etc., this infographic design focuses on keeping the message’s straight and clear. This makes data more lively than endless boring statistics or tables.
Takeaways ideas:
- Research finding results
- Business performance report
- Quantitative data summary
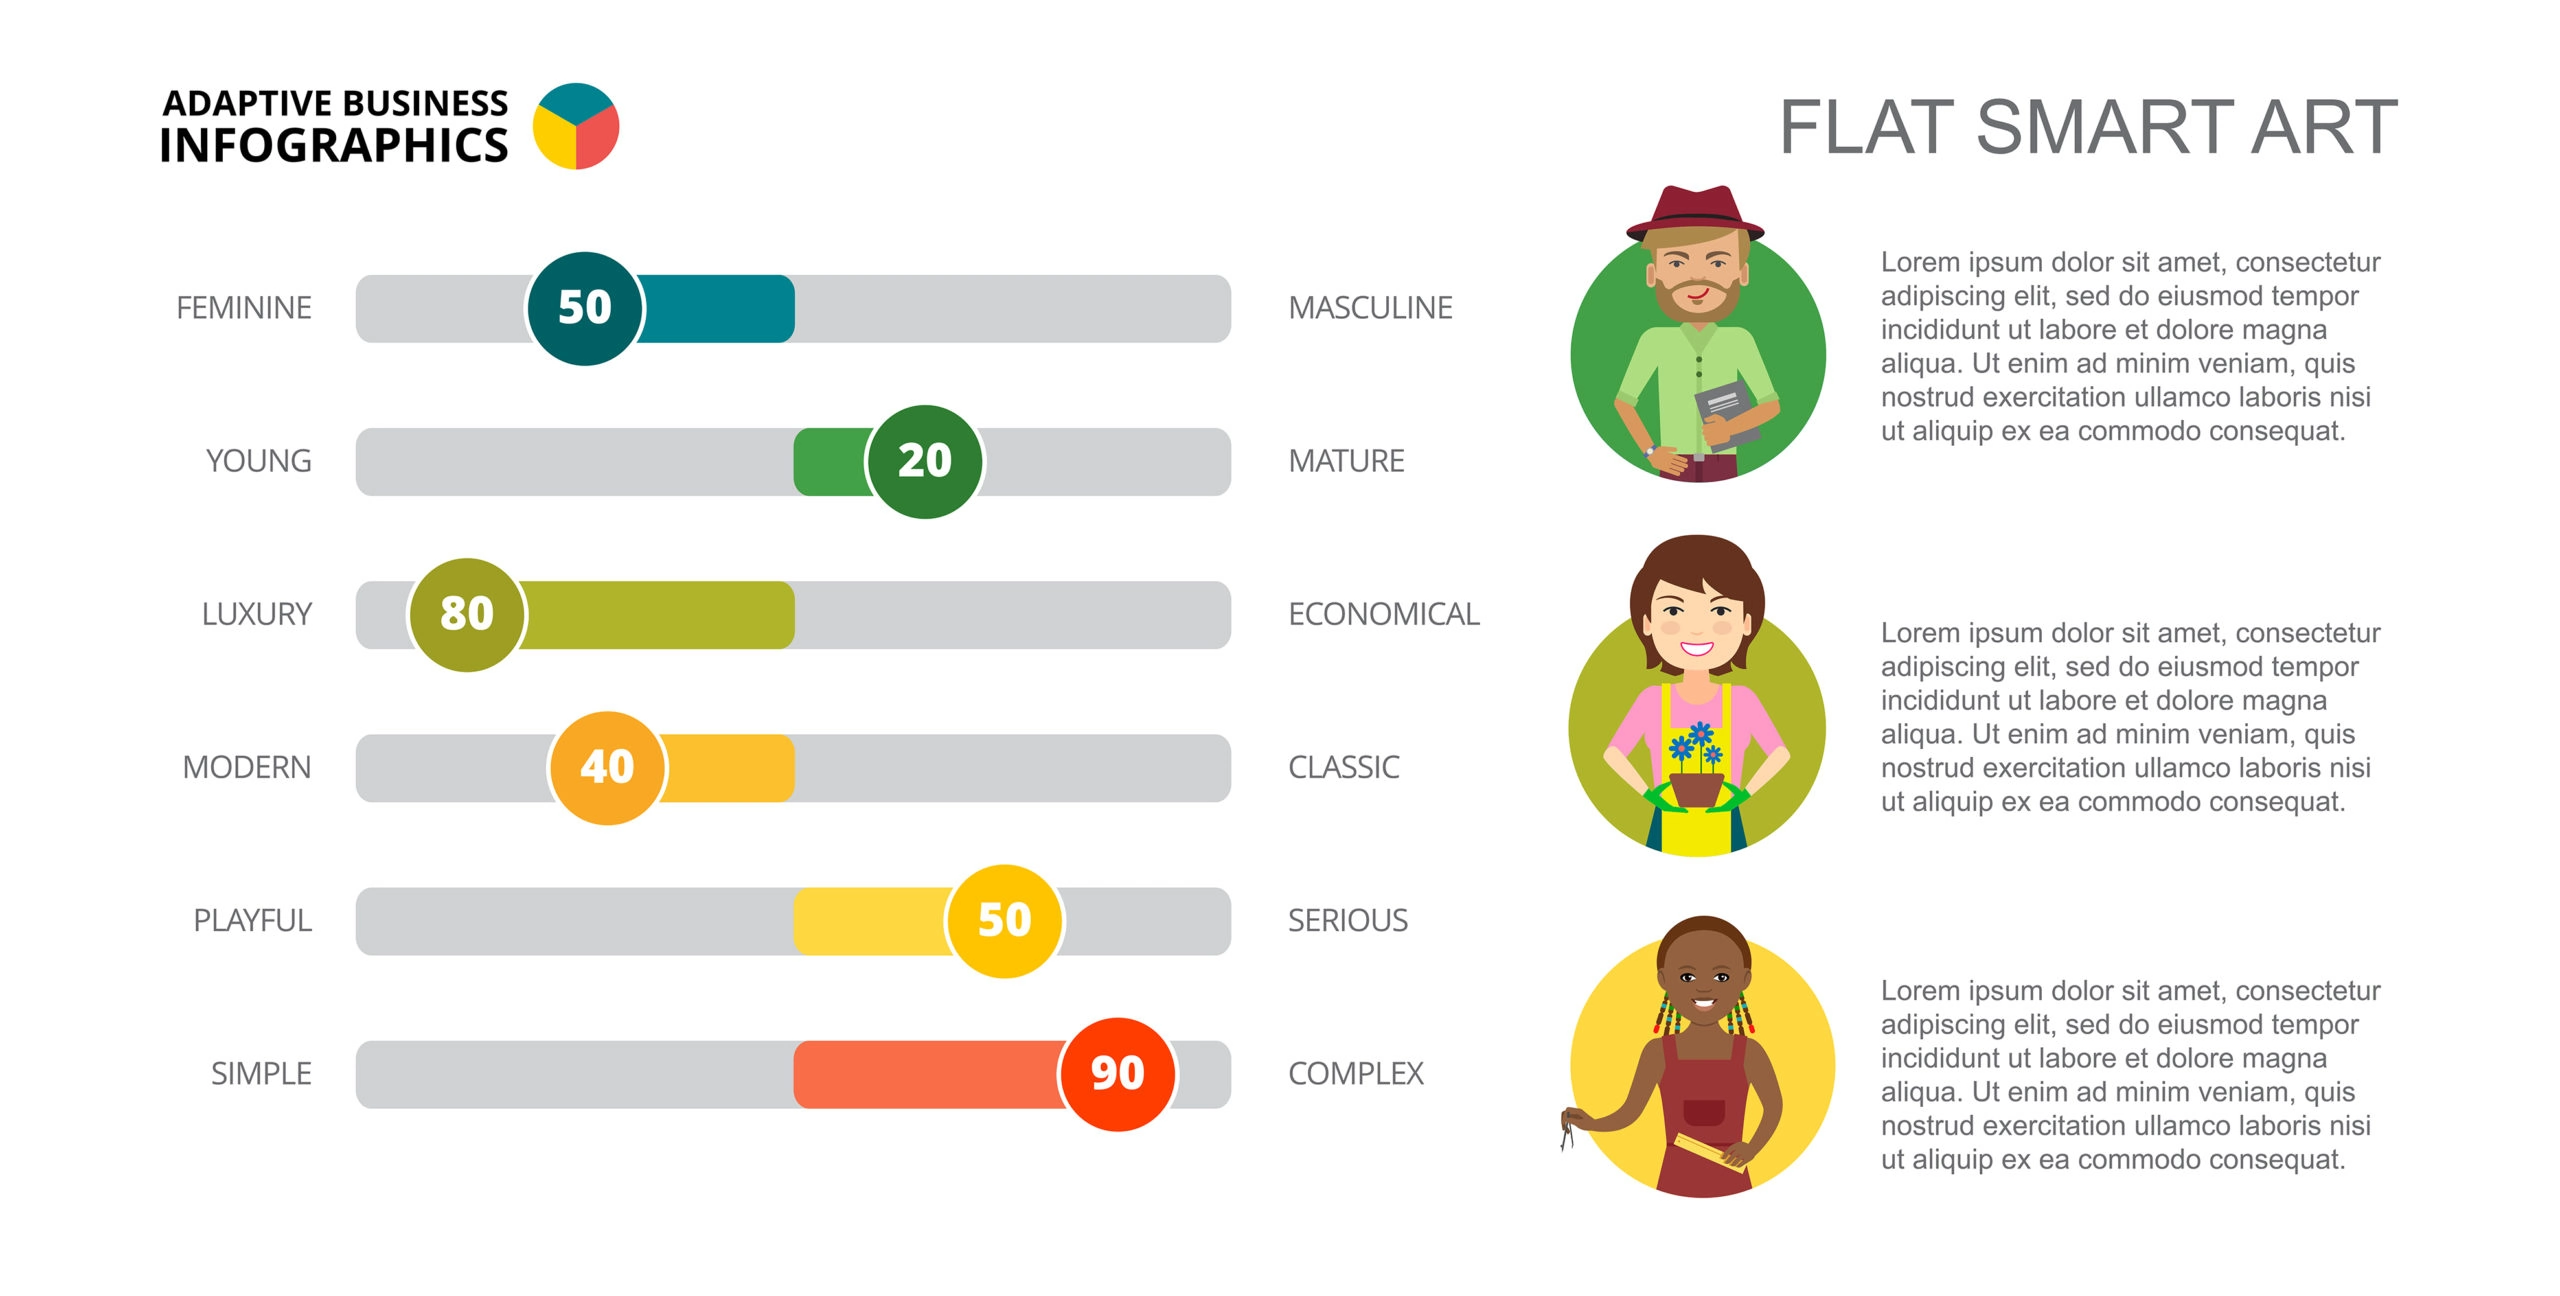
Image by Freepik
Types of Infographics #7: Flowchart
A flowchart uses boxes, flow lines, arrows, and others to reflect the steps of any process from start to finish. In doing so, flowchart infographics are applied to walk viewers through an array of stages or to drive decisions. This type of infographic is also called process, since it shows a complete view to finish something with full steps guide.
Takeaway ideas:
- How to cook Italian spaghetti
- Business/department structure
- Decision-making query process

Image by Freepik
Types of Infographics #8: Hierarchy
In terms of hierarchy, this type of infographic organizes information according to levels. Although most commonly seen in the shape of a pyramid, it can also be seen in the form of an organizational chart. Thus, the critical function of this infographic poster is to compare the different levels, ranks and show the connection between each of them.
Takeaway ideas:
- Hierarchy of human needs
- Top-down organization levels
- Priority list
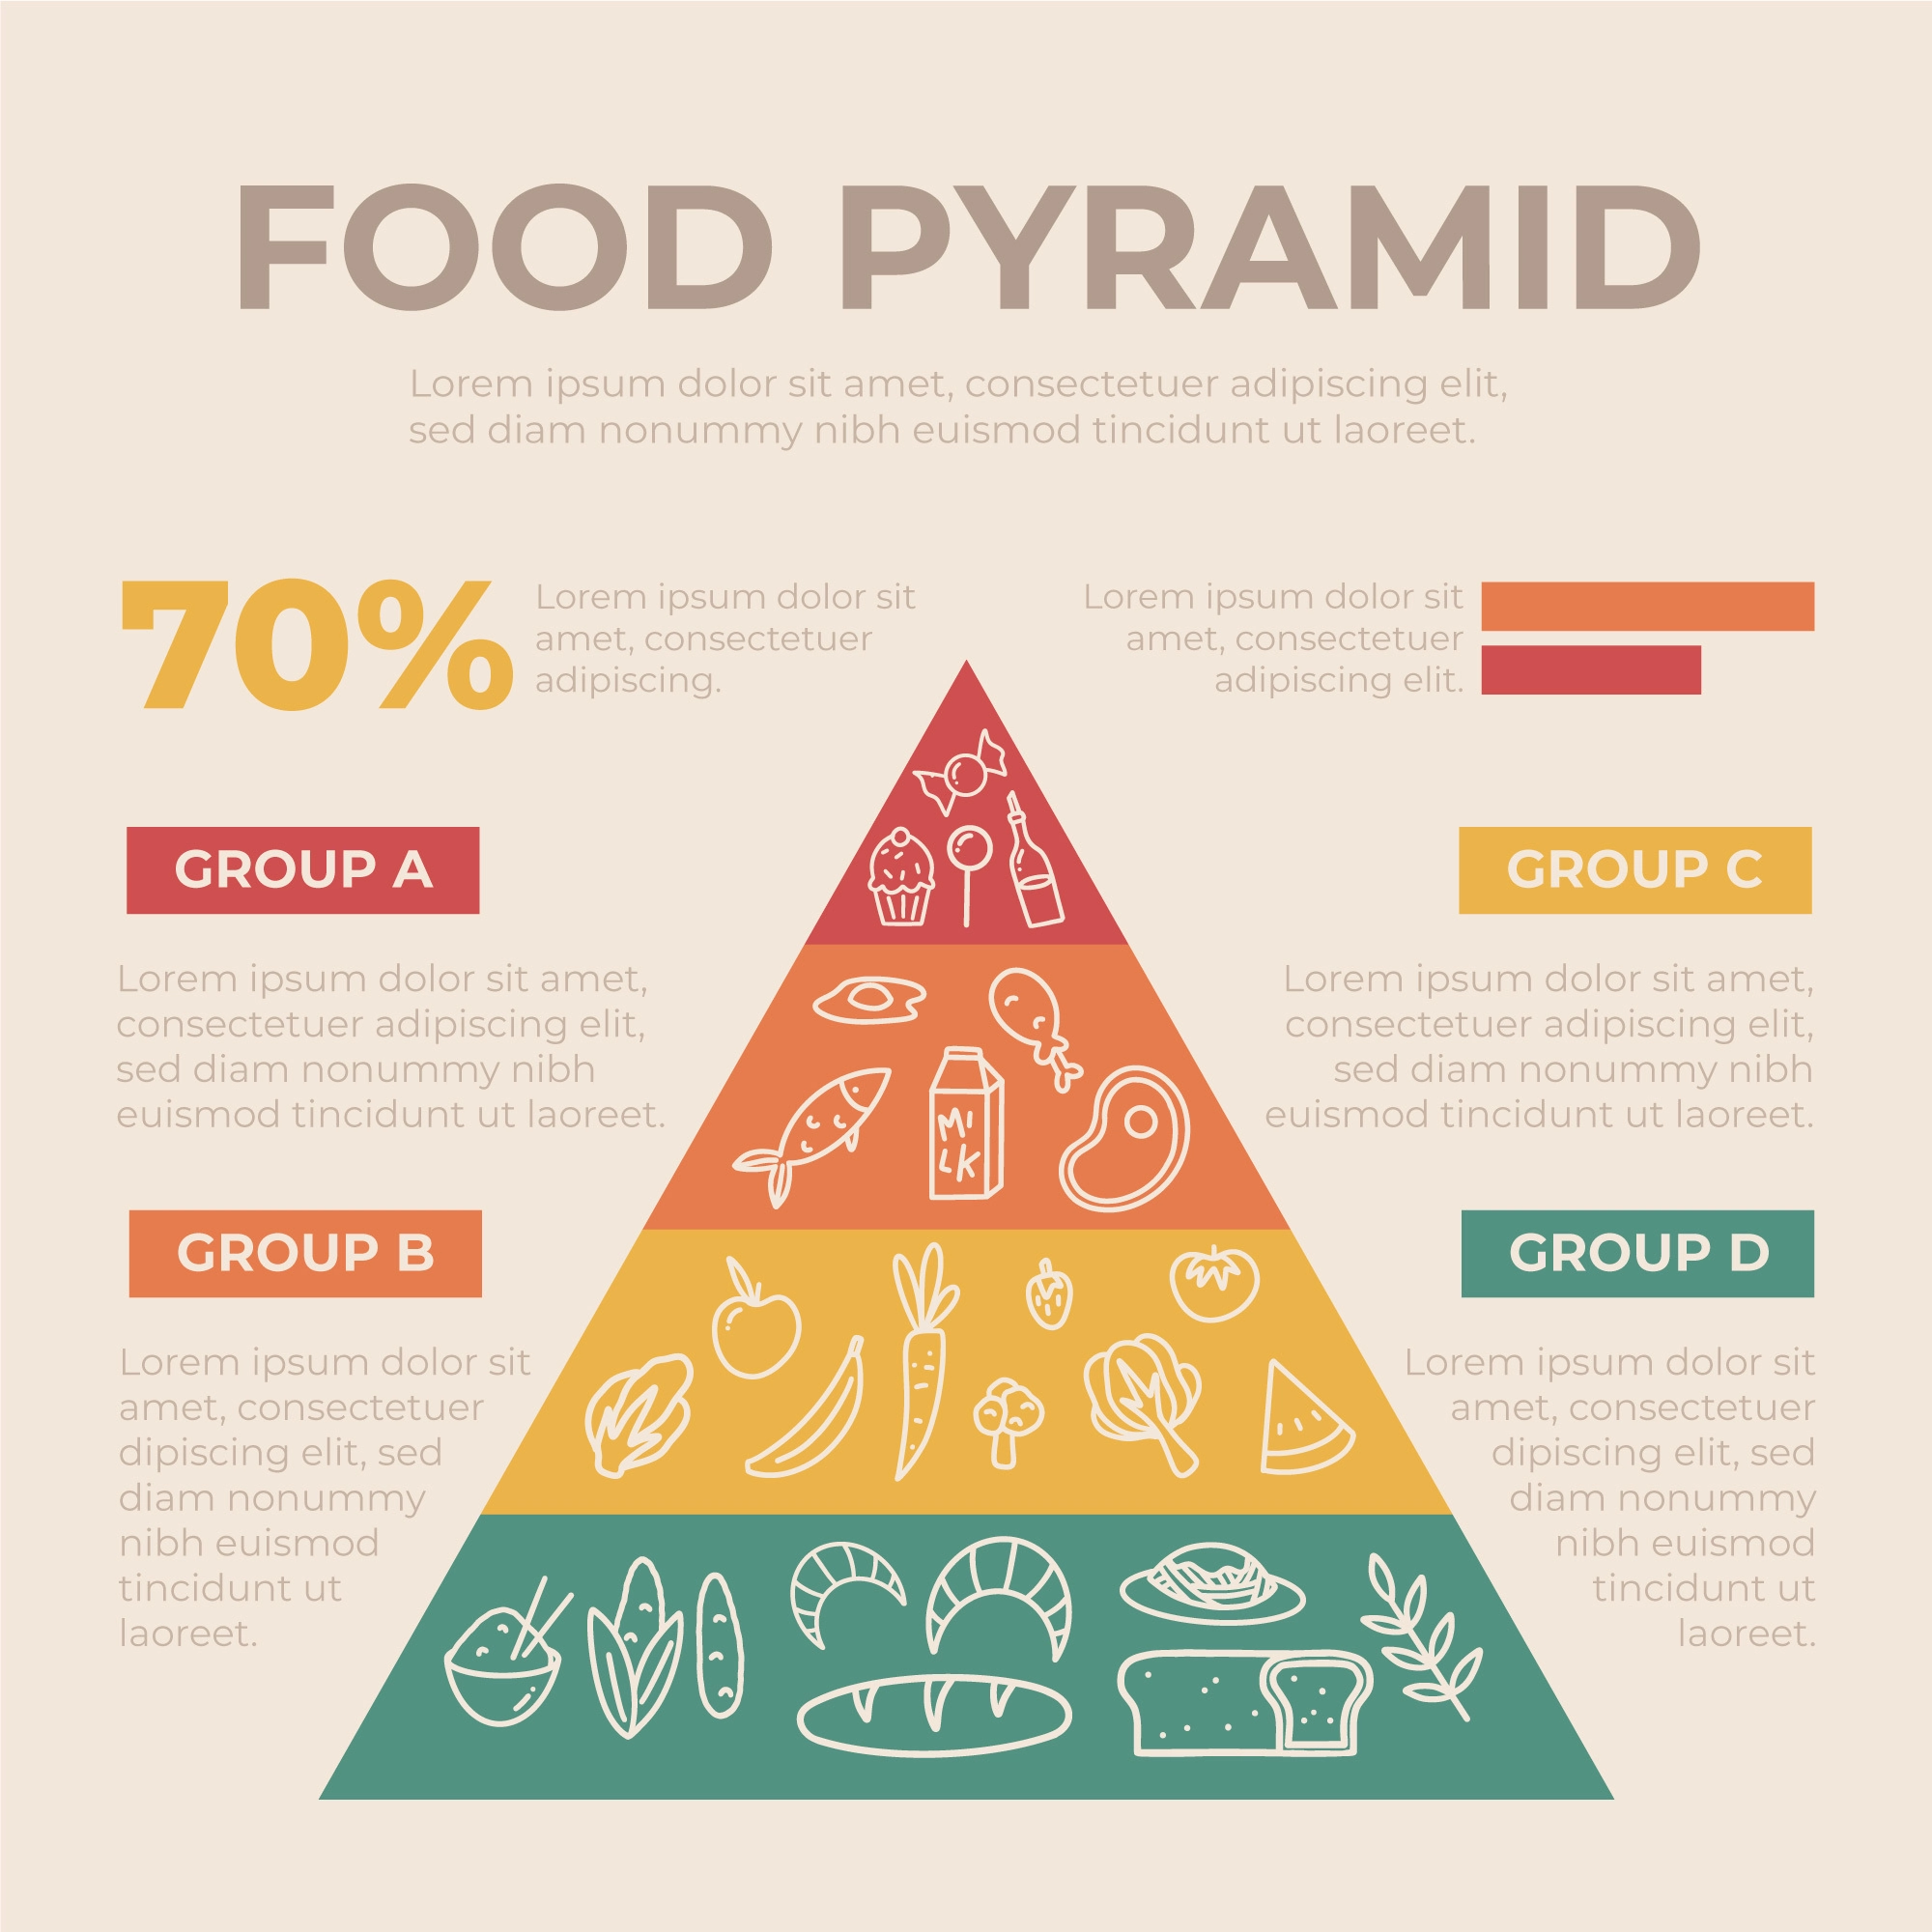
Image by Freepik
Types of Infographics #9: Anatomical
Searching for a way to break down elements? You can handle that with the aid of anatomy infographics. In detail, this type of infographic includes a framework using labeled diagrams to help you highlight and explain parts. Your audience may thank you for using anatomical infographics instead of describing them in words only.
Takeaways ideas:
- Human organs parts
- Earth’s crust structure
- Dinosaur body parts
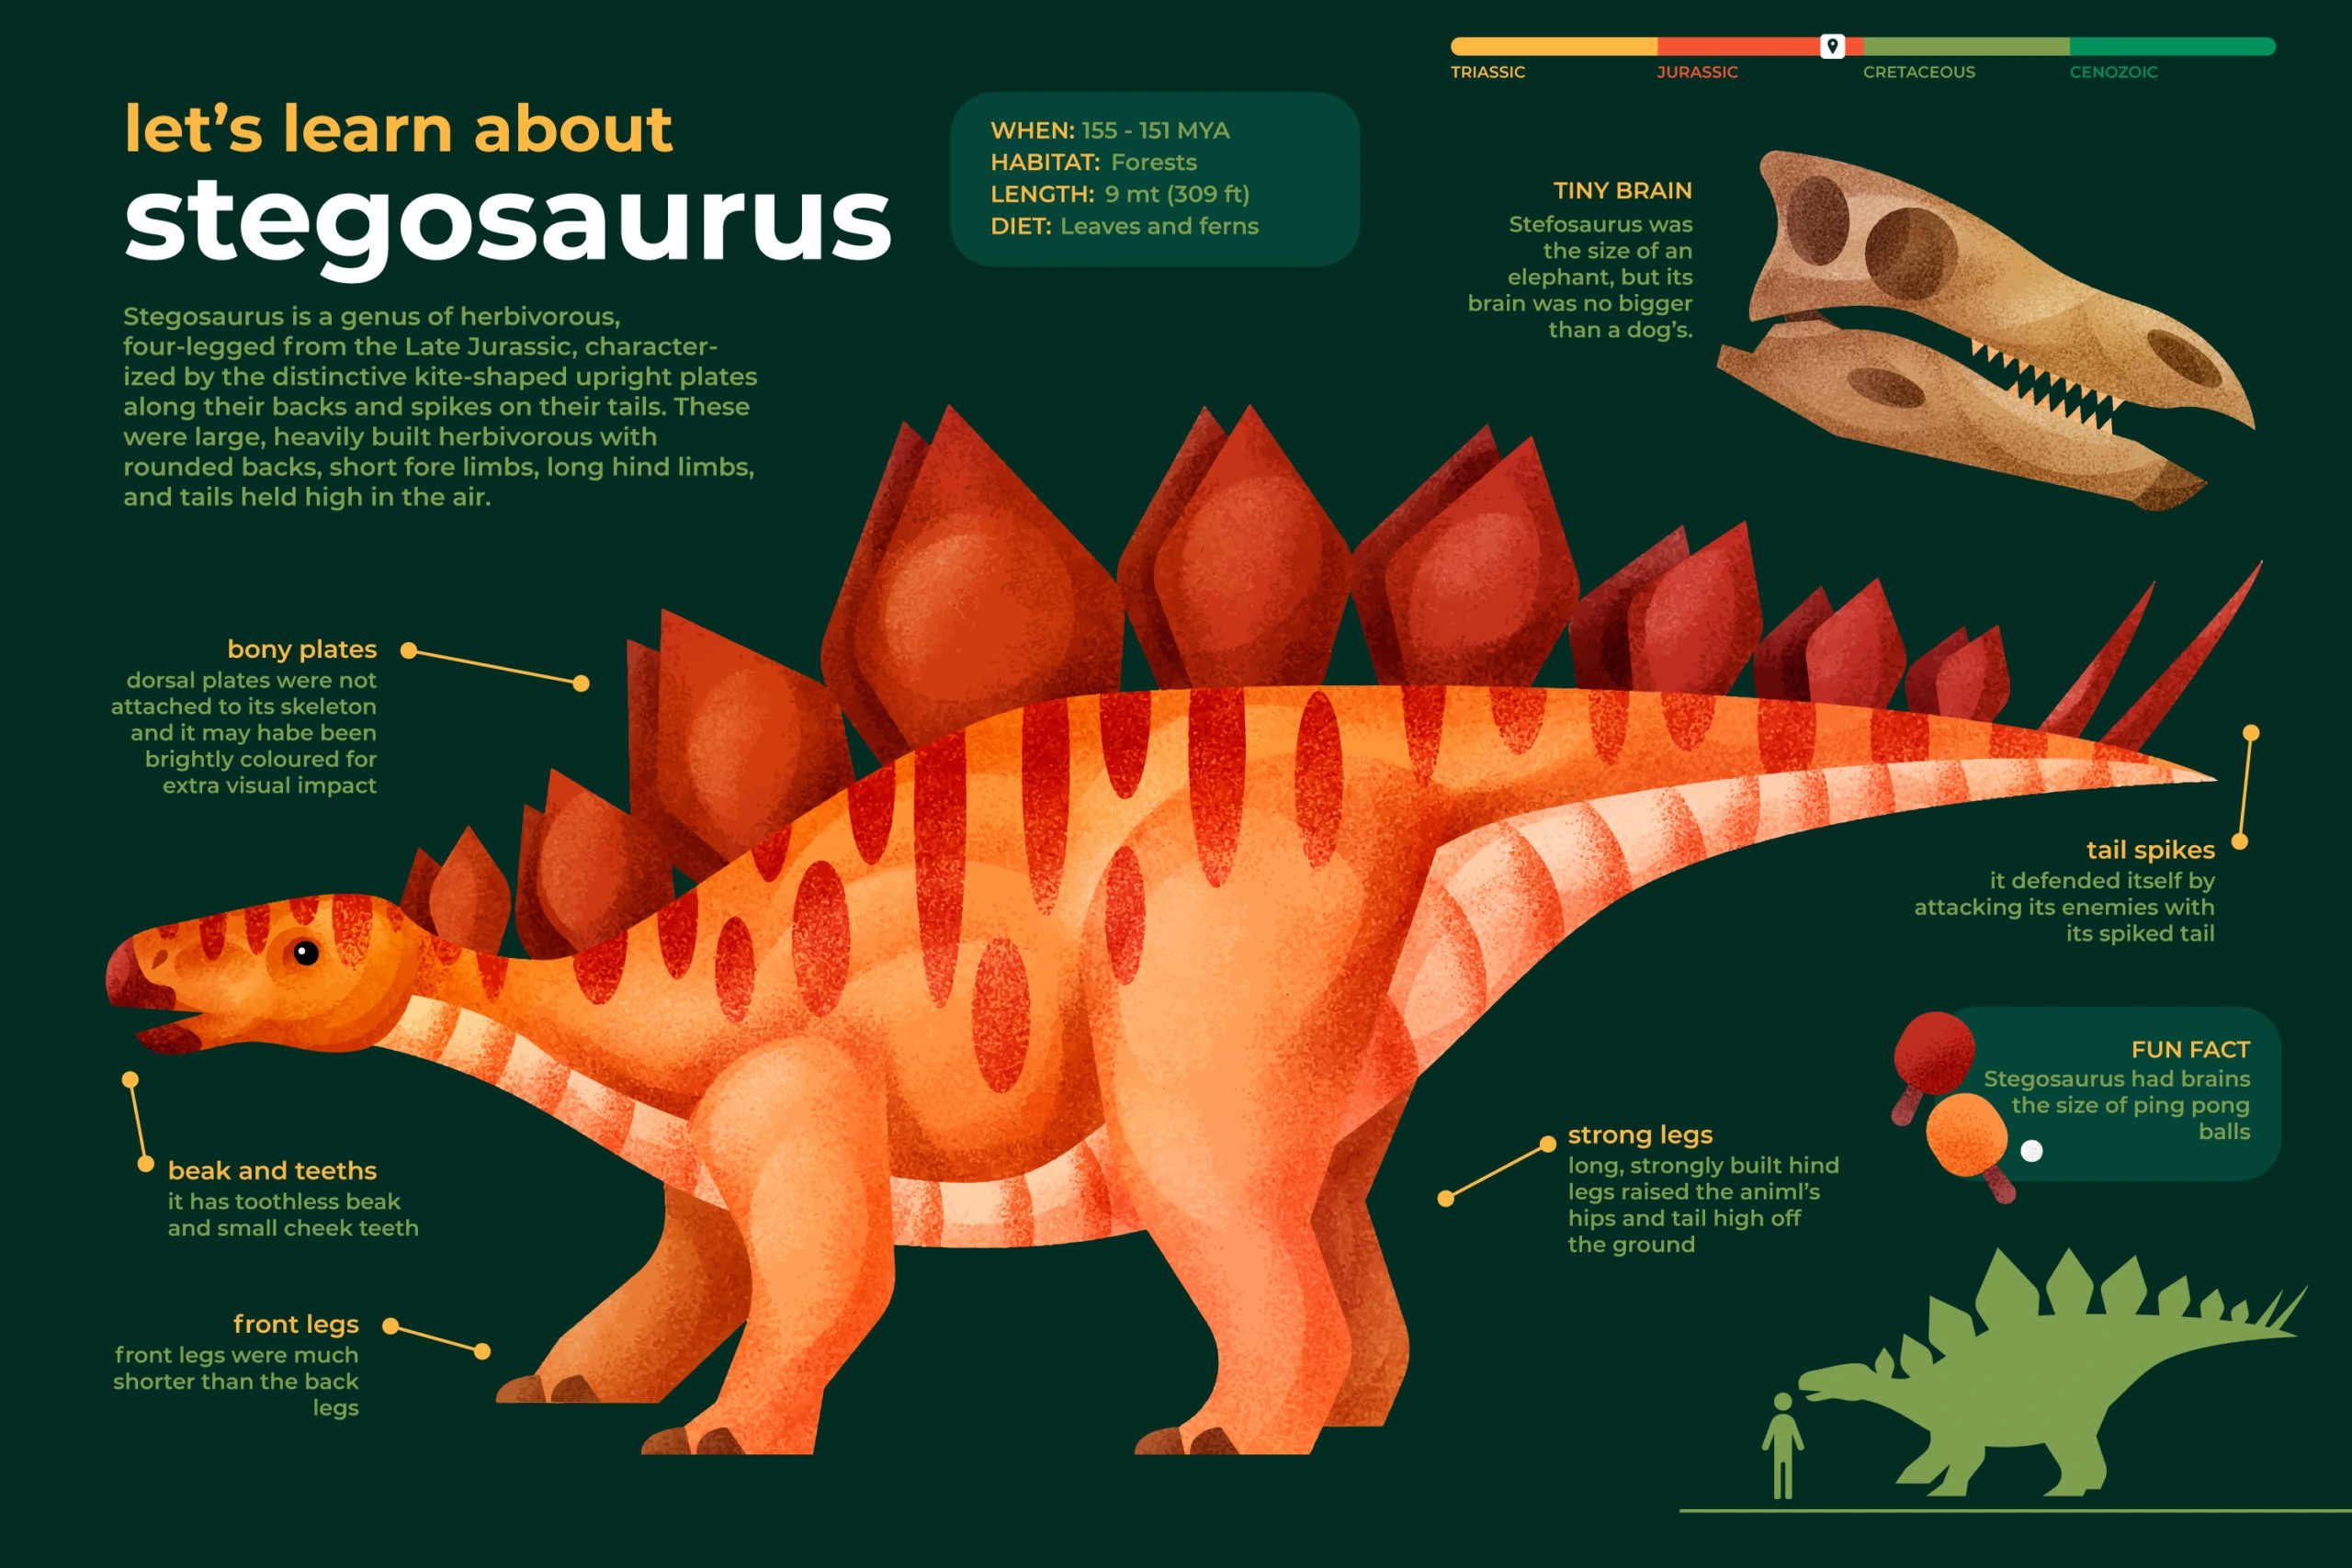
Image by Freepik
Types of Infographics #10: Animated
An animated infographic is a static infographic that includes certain animated elements to express movement and motion. In this situation, creatives can make an infographic poster animated by adding interactive components, transitions, or color schemes. You may also draw attention to the most important portions of your design by including subtle movements. Overall, there are 3 basic types of this infographic: GIF, Video, and HTML5. For detail, you can learn more about animated infographics overview and examples.
Takeaway ideas:
- Have you heard about….?
- Growth number of SMEs over the years
- Stock exchange index point daily showcase in a particular month
Let’s see how this kind of infographic example can save you space for presenting.

Made by ActivePresenter, all-in-one eLearning authoring tool, screen recorder and video editor, Free download & trial here:

Last Words
From the above types, we can see that infographics come in many different shapes and sizes. Therefore, before rolling up your sleeves into creation, you might think ahead about which types of infographics may fit the best. Picking out the right type will bring about the best result and efficiency and save you time for later work. Also, you can mix several types of infographics at your disposal, as long as the information is well-supplied to the audience’s needs. Finally, do not forget to follow our Blog and YouTube channel for the latest information.
See also:
Top 6 Websites to Delete Image Background
4 Places to Find out the Best Website Color Scheme Generator