Using infographics in education is a great way to help students perform better by effectively engaging them with visual content. Let’s explore why and how in today’s blog post.
It is no secret that the world is changing rapidly. The ever-increasing pace of technological growth has had a profound impact on nearly every aspect of our lives. One of the most radical changes that have taken place in recent years is the way it changes education practices. With that being said, educators have to actively take action to bring out the best learning experiences for students.
For that reason, using infographics in education is becoming trendy in this age, both online and offline. This article would analyze the benefits of applying infographics to educate students and how to incorporate them into lessons.
Looking to transform static infographics into dynamic learning experiences with ActivePresenter, our powerful eLearning authoring tool for teachers and trainers! Go beyond simple visuals and build interactive simulations and branching scenarios that present information in an engaging, infographic-style format. Bring your educational content to life with interactive elements, quizzes, and dynamic pathways that captivate learners and deepen understanding. Discover how ActivePresenter makes learning visually compelling and truly interactive.

Main Contents
What are Infographics? (Short Definition)
Why you should use Infographics in Education
You could apply Infographics in education for:

What are Infographics? (Short Definition)
For your information, information + graphics = “infographic”. Apart from templates, an infographic is also a visual portrait of content. It makes use of a variety of elements such as pictures, graphs, charts, icons & very little text. As a result, an infographic makes it easier to quickly and simply present the information. It is the ideal substitute when lengthy content and words alone can not fully express your ideas. It is estimated that, there are around 10 types of infographics available to apply in teaching and learning field.
Why You Should Use Infographics
1. Increase Attention Span
“Timing is everything” is a proverb that stays true in both life and education. The way teachers use their first 10-15 minutes in a class will decide the rest of the lesson. Likewise, how lessons are organized affects how well students absorb and remember the material. In other words, using infographics to clarify a difficult concept in education can help students in grasping the larger picture and understand the forest for the trees.
Why infographics but not other methods? According to MDS Magazine, nearly two-thirds of people call themselves visual learners. Articles with relevant images get on average 94% more views compared to articles without images. If you are still doubtful, think about Pinterest and Instagram, they speak of themselves as thriving photo-driven social apps. Thus, infographics combined with text, numbers, and vivid illustrations surely bring effects to the table.

2. Summarize Information
There is an old adage, “A picture is worth a thousand words”. A single image still can express complex ideas more effectively than only verbal language. In other words, puzzling written information can be simplified just by using image(s). Rather than presented with blocks of text, infographics also have a number of design formats with different purposes. Teachers can use infographics in education such as summarize info, timeline, process, or sum up statistics from research.
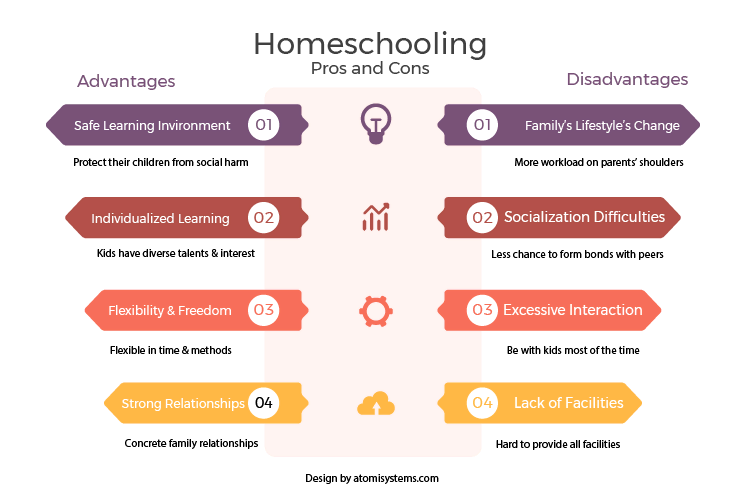
Let us give you an example of homeschooling’s advantages and disadvantages. Presenting with texts and then highlighting key points is a good choice for readers to follow. But in case you bring it out to deliver lessons, how about making it more vivid with infographics like this.
3. Improve Memorization
Infographics are an effective way to grow memory because they present information in a visual format. This makes it easier for students to retain the information. On average, people only remember 10% of the information for three days after hearing it, but adding a visual image can increase recall to 65%.
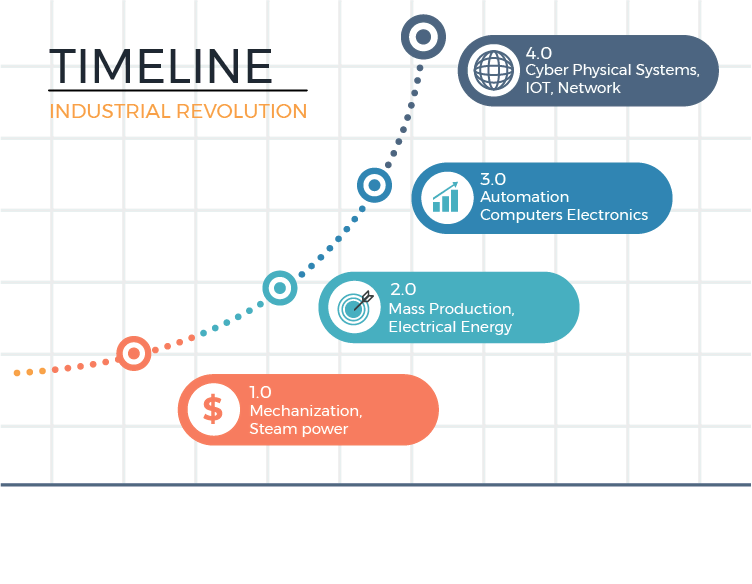
For example, let’s say you’re teaching about the history of the industrial revolution and how it developed. You could show an infographic with all of these vital facts: time and the most highlighted features. These infographics would make it easy for education because they were presented visually through images rather than text only.
How You Could Apply Infographics in Education
1. Use Infographics for Study Reviews Sessions in Education
As a teacher, what will you do when you pour out a lot of effort but students keep forgetting by the time? As a student, when you are in a nick of time cramming for exams, would you prefer to read a wall of texts or a vivid summary note? I bet you prefer the latter one. Since time is not on our side, using effective learning methods would be the chief demand at that time.
Hence, infographics fill in the blanks to serve as a workhorse both for teachers and students in the education field. Teachers can use infographics to sum up key points for the lessons. In the meantime, students are able to utilize them to recall lessons when revising before exams. It is a win-win solution, isn’t it?

2. Use Infographics for Presentations Activities in Education
According to research from Microsoft Corp., the time to catch people’s attention has decreased sharply from 12 seconds in 2000 to 8.25 in 15 years. Products displayed in the supermarket only have 7 seconds to take customers’ notice. The world is competing non-stop to win over your buying decisions. The story is also staying true when teachers or students have to give presentations. Using correct methods at the first hand will help them hold the attention of the audience from the beginning. Therefore, using infographics would save time for transmitting information while maintaining quality.
Teachers can let students research something for education, sum it up in infographics then describe it. Just remember to let students have their own creative space. After that, teachers can ask the audience related questions to check whether they still get the point. If the answer is correct, infographics more or less may give it a hand. In this example, if you are running a yoga class, try to sum it up in one education infographic like this:

3. Use Infographics for Homework Assignments in Education
Teachers in the education sector can assign students to do infographics homework. Teachers can give out a long text of information and let them transform it to make it more appealing. In other ways, teachers can appoint students to sum up what they have learned by infographics. According to Dale’s Cone research, people will remember 90% of what they do when performing a task. In doing so, students not only remember the lesson well but also are given a chance to uncover their creativity. Likewise, if students find that the original infographics make them feel dry or dull, they will seek to make infographics more vivid. Animated infographics are a perfect example of bringing your content to life. You could take this as your infographic template.
| Replace a wall of texts | With lively infographics |
| 10% of what they read 20% of what they hear 30% of what they see 50% of what they see and hear 70% of what they say and write 90% of what they do as they perform a task |  |
Final Words
All in all, using infographics is mainly regarded as a visual aid to enhance the educational experience. This kind of modern-age tool empowers both teachers and learners to be more flexible and creative in teaching activities. If you need other methods besides using infographics, you can refer to how to extend the attention span for suggestions.
See more:
5 Engaging Visual Design Elements In eLearning You Should Know