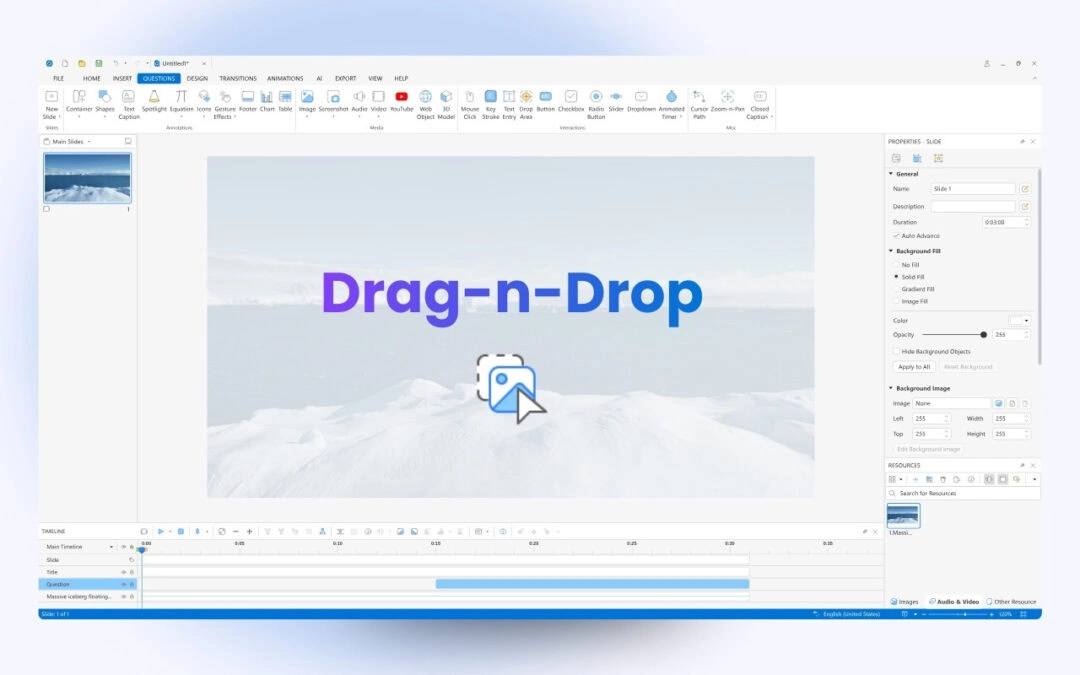
The Drag-n-Drop question is a type of matching question. It requires learners to drag a text or image and drop it into the correct area called drop target. Using this question type, you can create many engaging games without consuming a lot of time and effort. With...
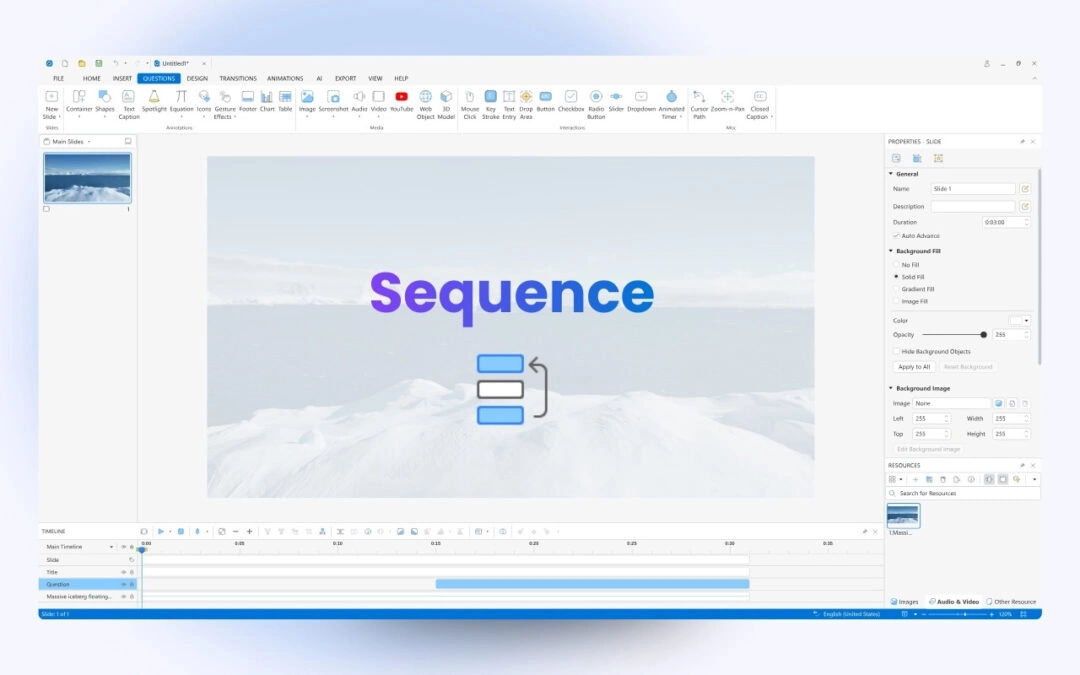
Sequence question is one of the 13 question types in ActivePresenter 10 – an eLearning authoring software. This question requires you to rearrange items into the right order. In this tutorial, you will learn more about it. Take a look at the example below....
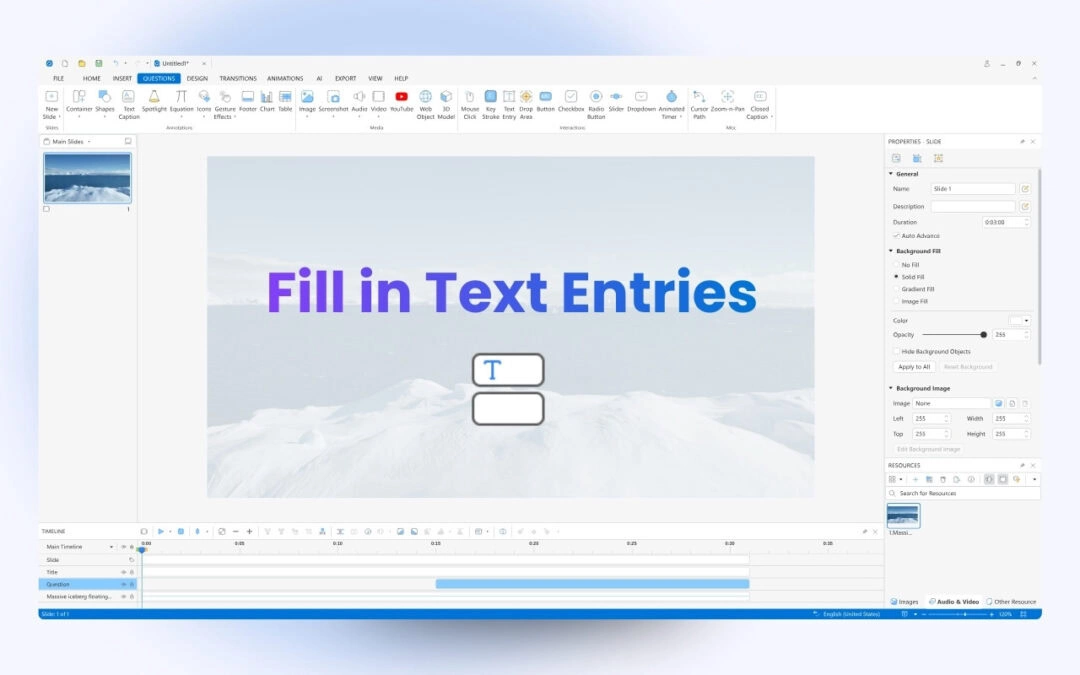
It can be said that the Fill in Text Entries question is a variant of the Fill in Text Entry one. From its name, you can see that the only difference is that the Fill in Text Entries question includes more than one text entry for learners to type their answers. ...
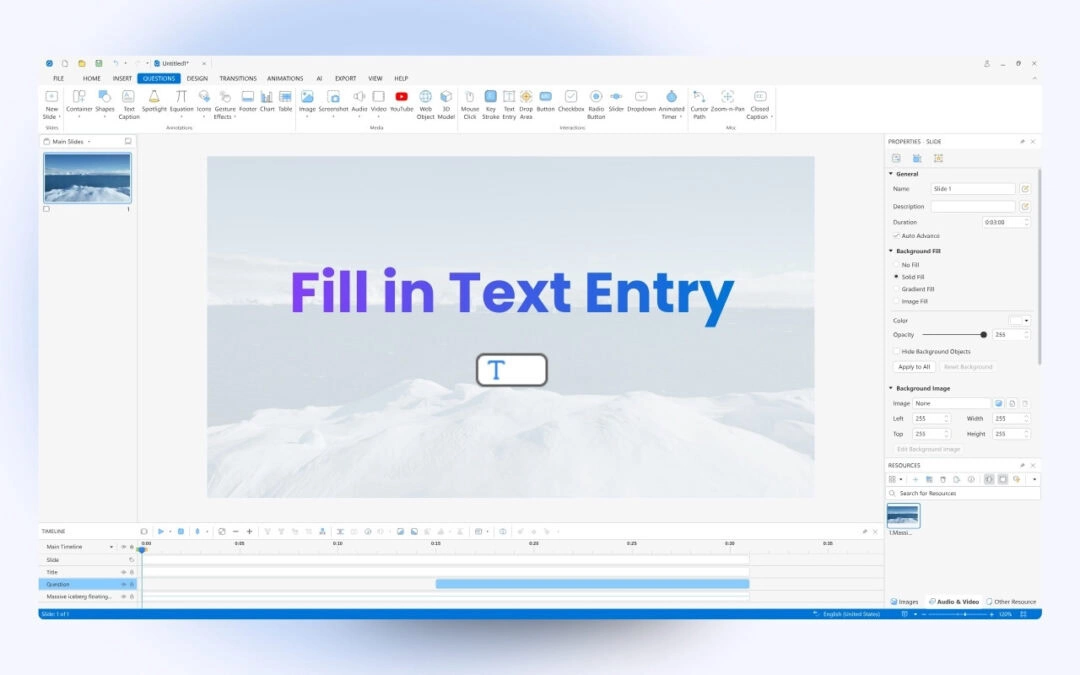
In the previous articles, you’ve learned how to create many interactive question types in ActivePresenter 10 such as True/False, Multiple Choice, Multiple Response and Essay questions. Now, turn to the next one – Fill in Text Entry questions. Like Essay...
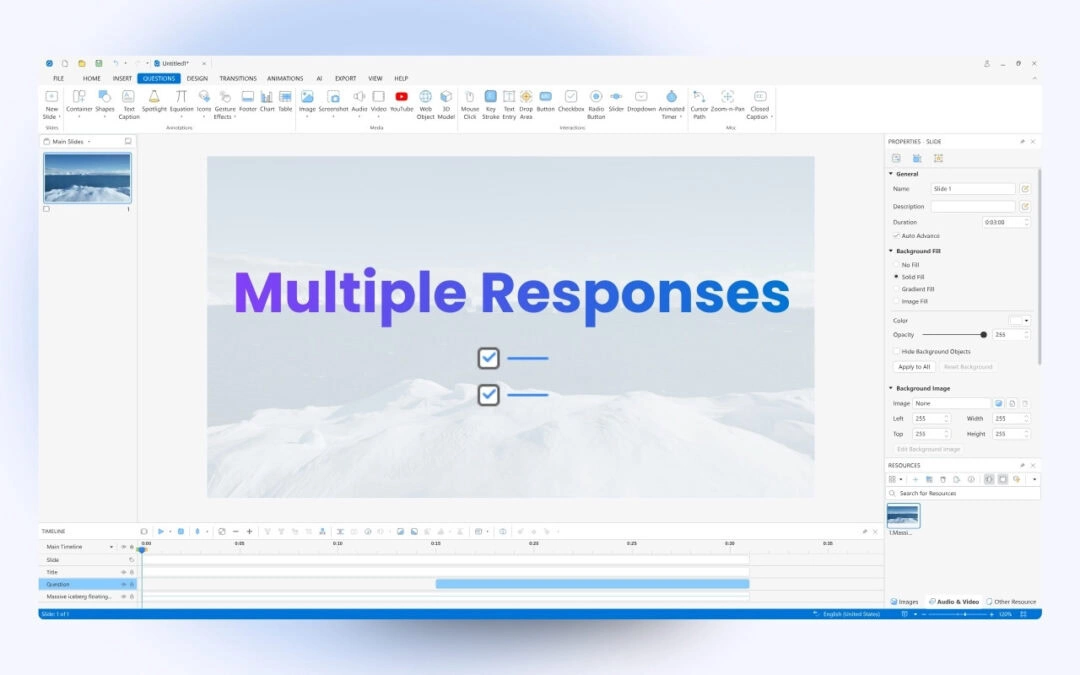
The Multiple Response question is also a popular question type in creating tests. So, inthis article, you will learn how to create this question type in ActivePresenter 10 – a toolt to create interactive quizzes A Multiple Response question has a quite same...
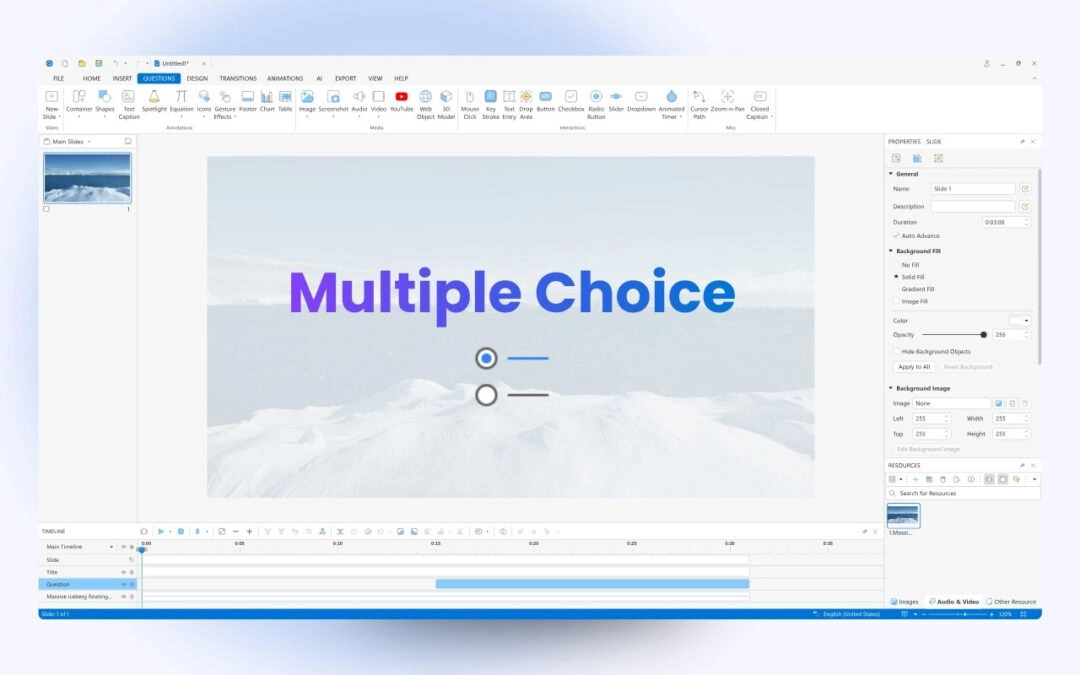
Given quick assessment and the ability to provide immediate feedback, a multiple choice quiz can be a simple and favored approach to gauge learners’ knowledge. A Multiple Choice quiz consists of numerous multiple choice questions. Each question has two parts: a...