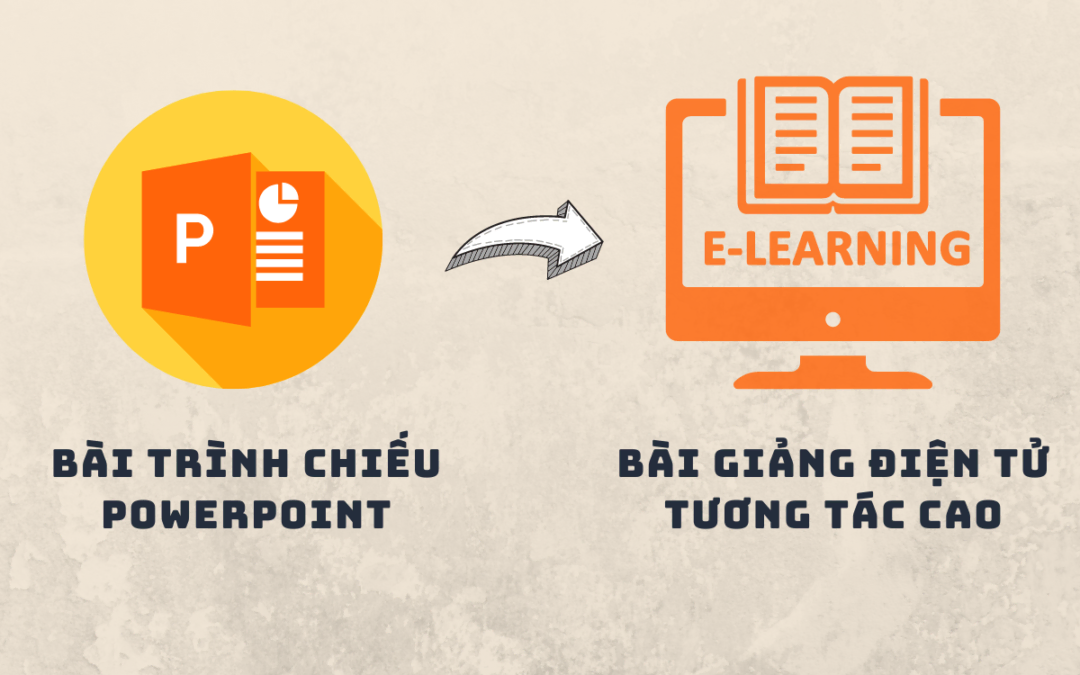
Bài trình chiếu PowerPoint của bạn thiếu sự tương tác với học sinh? Đừng lo lắng. ActivePresenter là phần mềm thiết kế bài giảng eLearning toàn diện giúp chuyển đổi bài giảng PowerPoint sang bài giảng điện tử có tính tương tác cao một cách dễ dàng và nhanh chóng. Hiện...
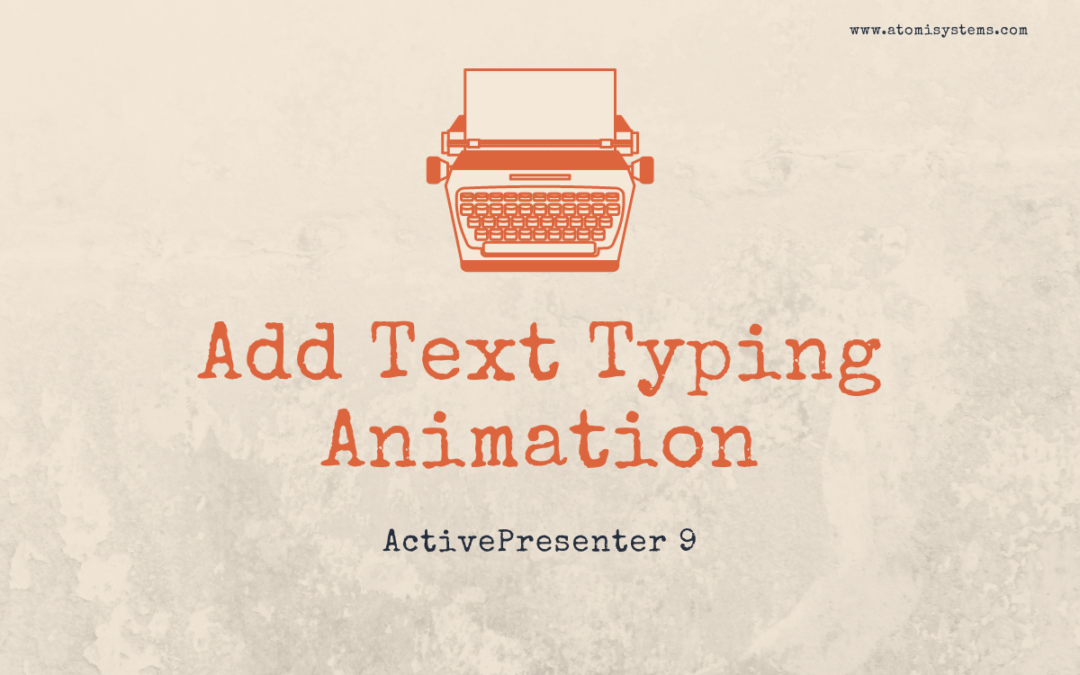
You can create animations for text in various ways, one of which is adding a typing effect or so-called typewriter effect to your text. The eye-popping text typing animation is quick to be done by animating letters or words. This tutorial covers: Add Text Format Text...
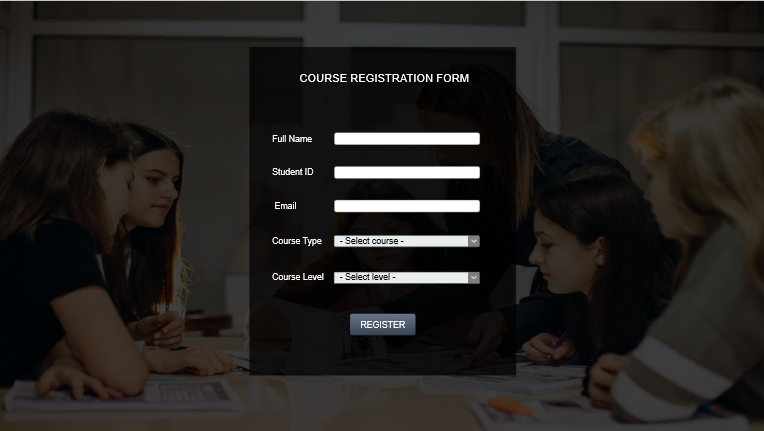
The dropdown menu is a kind of interactive element that helps your eLearning courses have a well-arranged look. Depending on their purposes, dropdown menus can be used for form filling, navigation, attribute selections, and so on. When you have a...
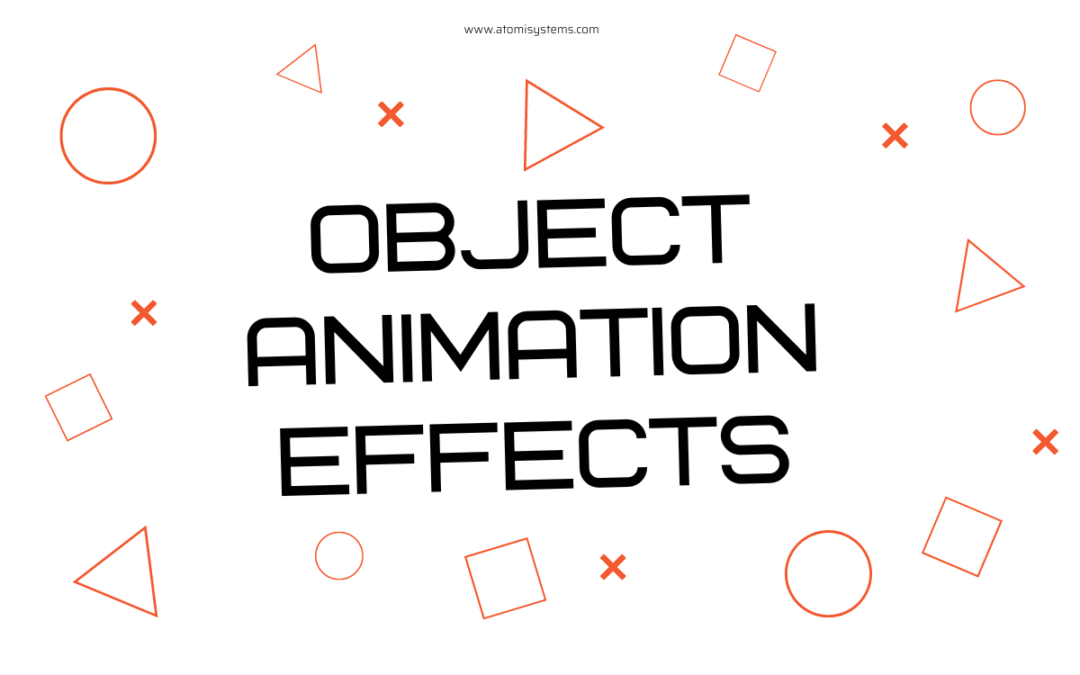
ActivePresenter 9 allows you to create object animation effects with four types: Entrance, Exit, Emphasis, and Motion Path. There are up to 80 effects of all types that help bring your content to life effortlessly. Creating animation for objects in your projects...
ActivePresenter is a stand-alone powerful authoring tool for eLearning course design. If you need a solution to help track this eLearning content and report the results, SCORM Cloud comes to your aid. Please find below a summary of each tool and their compatibility....