Line charts are best to track data changes over periods. This chart type shows data points connected by straight lines or curve lines. Today’s tutorial will give you details about how to create line charts in ActivePresenter 9. Let’s start by walking through an...
Word Search Puzzle can be used as an eLearning game to make your courses highly interactive and more engaging. With simple steps, ActivePresenter will help you create a puzzle of your own. Word Search Puzzle is a popular game that requires players to locate a...
Just like Column charts, Bar charts are ideal for showing trend data or comparisons among items or categories. But when there are a great number of categories, using Bar charts is a better choice. Let us explain them to you in this tutorial. A bar chart...
Là một tài nguyên đơn giản và tốn ít dung lượng, ảnh động GIF đã và đang được sử dụng rộng rãi trong lĩnh vực eLearning. Sau đây chúng ta hãy cùng đi sâu vào tìm hiểu ảnh động GIF là gì và cách sử dụng chúng một cách hiệu quả. Cho đến nay, lĩnh vực...
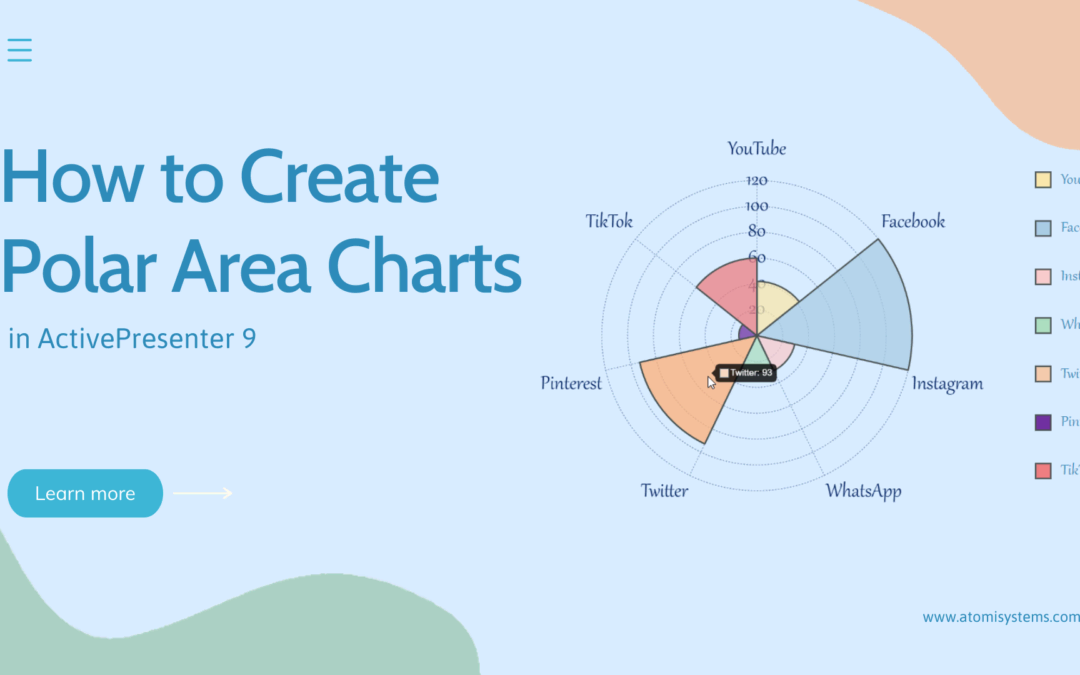
Polar Area charts are quite similar to Pie charts. However, this chart type is widely used to plot cyclic data. If you want to create a Polar Area chart then ActivePresenter 9 will help you in no time. If you are new to the Polar Area chart, you can search for...